200 Financial information Annual Report 2012 Zurich Insurance Group
Consolidated financial statements continued
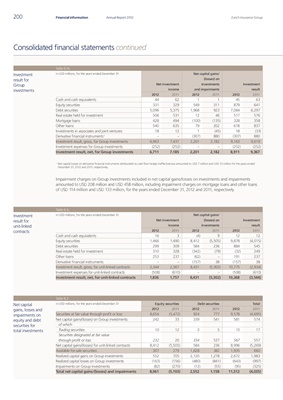
Table 6.1b
Investment in USD millions, for the years ended December 31 Net capital gains/
result for (losses) on
Group Net investment investments Investment
investments income and impairments result
2012 2011 2012 2011 2012 2011
Cash and cash equivalents 44 62 1 1 45 63
Equity securities 331 329 549 311 879 641
Debt securities 5,096 5,375 1,968 923 7,064 6,297
Real estate held for investment 506 531 12 46 517 576
Mortgage loans 428 494 (100) (135) 328 358
Other loans 540 635 79 202 618 837
Investments in associates and joint ventures 18 12 1 (45) 18 (33)
Derivative financial instruments 1 – – (307) 880 (307) 880
Investment result, gross, for Group investments 6,963 7,437 2,201 2,182 9,163 9,619
Investment expenses for Group investments (252) (252) – – (252) (252)
Investment result, net, for Group investments 6,711 7,185 2,201 2,182 8,911 9,367
1
Net capital losses on derivative financial instruments attributable to cash flow hedge ineffectiveness amounted to USD 7 million and USD 13 million for the years ended
December 31, 2012 and 2011, respectively.
Impairment charges on Group investments included in net capital gains/losses on investments and impairments
amounted to USD 208 million and USD 458 million, including impairment charges on mortgage loans and other loans
of USD 114 million and USD 133 million, for the years ended December 31, 2012 and 2011, respectively.
Table 6.1c
Investment in USD millions, for the years ended December 31 Net capital gains/
result for Net investment (losses) on Investment
unit-linked income investments result
contracts 2012 2011 2012 2011 2012 2011
Cash and cash equivalents 16 3 (4) 9 12 12
Equity securities 1,466 1,490 8,412 (5,505) 9,878 (4,015)
Debt securities 299 309 584 236 884 545
Real estate held for investment 310 328 (342) (79) (32) 249
Other loans 253 237 (62) – 191 237
Derivative financial instruments – – (157) 38 (157) 38
Investment result, gross, for unit-linked contracts 2,344 2,367 8,431 (5,302) 10,775 (2,934)
Investment expenses for unit-linked contracts (508) (610) – – (508) (610)
Investment result, net, for unit-linked contracts 1,836 1,757 8,431 (5,302) 10,268 (3,544)
Table 6.2
Net capital in USD millions, for the years ended December 31 Equity securities Debt securities Total
gains, losses and 2012 2011 2012 2011 2012 2011
impairments on Securities at fair value through profit or loss: 8,654 (5,472) 924 777 9,578 (4,695)
equity and debt Net capital gains/(losses) on Group investments 242 33 339 541 581 574
securities for of which:
total investments Trading securities 10 12 5 5 15 17
Securities designated at fair value
through profit or loss 232 20 334 537 567 557
Net capital gains/(losses) for unit-linked contracts 8,412 (5,505) 584 236 8,996 (5,269)
Available-for-sale securities: 307 279 1,628 382 1,935 660
Realized capital gains on Group investments 552 705 2,120 1,278 2,672 1,983
Realized capital losses on Group investments (163) (156) (480) (841) (643) (997)
Impairments on Group investments (82) (270) (12) (55) (95) (325)
Total net capital gains/(losses) and impairments 8,961 (5,193) 2,552 1,158 11,512 (4,035)