Zurich Insurance Group Annual Report 2012 Consolidated financial statements 203
The analysis in table 6.4 is provided by contractual maturity. Actual maturities may differ from contractual
maturities because certain borrowers have the right to call or prepay certain obligations with or without call or
prepayment penalties.
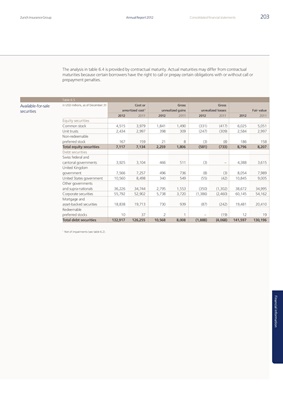
Table 6.5
Available-for-sale in USD millions, as of December 31 Cost or Gross Gross
securities amortized cost 1 unrealized gains unrealized losses Fair value
2012 2011 2012 2011 2012 2011 2012 2011
Equity securities
Common stock 4,515 3,979 1,841 1,490 (331) (417) 6,025 5,051
Unit trusts 2,434 2,997 398 309 (247) (309) 2,584 2,997
Non-redeemable
preferred stock 167 159 21 8 (3) (8) 186 158
Total equity securities 7,117 7,134 2,259 1,806 (581) (733) 8,796 8,207
Debt securities
Swiss federal and
cantonal governments 3,925 3,104 466 511 (3) – 4,388 3,615
United Kingdom
government 7,566 7,257 496 736 (8) (3) 8,054 7,989
United States government 10,560 8,498 340 549 (55) (42) 10,845 9,005
Other governments
and supra-nationals 36,226 34,744 2,795 1,553 (350) (1,302) 38,672 34,995
Corporate securities 55,792 52,902 5,738 3,720 (1,386) (2,460) 60,145 54,162
Mortgage and
asset-backed securities 18,838 19,713 730 939 (87) (242) 19,481 20,410
Redeemable
preferred stocks 10 37 2 1 – (19) 12 19
Total debt securities 132,917 126,255 10,568 8,008 (1,888) (4,068) 141,597 130,196
1
Net of impairments (see table 6.2).
Financial information