Zurich Insurance Group Annual Report 2012 Consolidated financial statements 253
Group investments and other non-unit linked financial instruments carried at fair value
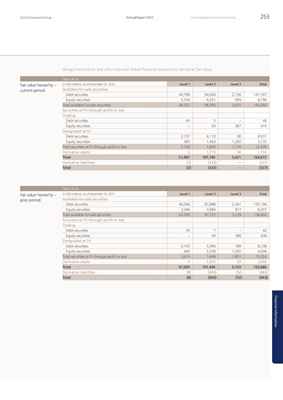
Table 26.2a
Fair value hierarchy – in USD millions, as of December 31, 2012 Level 1 Level 2 Level 3 Total
current period Available-for-sale securities
Debt securities 44,796 94,064 2,736 141,597
Equity securities 3,526 4,331 939 8,796
Total available-for-sale securities 48,322 98,395 3,675 150,392
Securities at FV through profit or loss
Trading
Debt securities 43 5 – 48
Equity securities – 43 367 410
Designated at FV
Debt securities 2,737 6,110 90 8,937
Equity securities 383 1,493 1,260 3,135
Total securities at FV through profit or loss 3,163 7,650 1,716 12,530
Derivative assets 2 1,719 30 1,750
Total 51,487 107,765 5,421 164,672
Derivative liabilities (3) (533) – (537)
Total (3) (533) – (537)
Table 26.2b
Fair value hierarchy – in USD millions, as of December 31, 2011 Level 1 Level 2 Level 3 Total
prior period Available-for-sale securities
Debt securities 40,046 87,888 2,261 130,196
Equity securities 3,346 3,884 977 8,207
Total available-for-sale securities 43,392 91,772 3,239 138,402
Securities at FV through profit or loss
Trading
Debt securities 35 7 – 42
Equity securities – 40 398 438
Designated at FV
Debt securities 3,155 5,394 189 8,738
Equity securities 483 2,258 1,265 4,006
Total securities at FV through profit or loss 3,673 7,699 1,851 13,224
Derivative assets 4 2,023 33 2,060
Total 47,069 101,494 5,123 153,686
Derivative liabilities (8) (603) (52) (663)
Total (8) (603) (52) (663)
Financial information