Zurich Insurance Group Annual Report 2012 1
Performance overview
Group overview
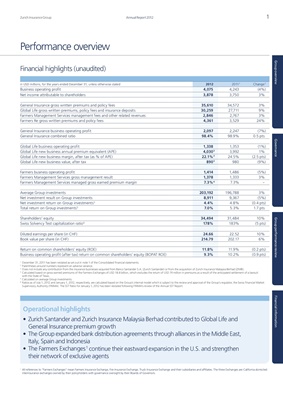
Financial highlights (unaudited)
in USD millions, for the years ended December 31, unless otherwise stated 2012 2011 1 Change 2
Business operating profit 4,075) 4,243 (4%)
Net income attributable to shareholders 3,878) 3,750 3%
General Insurance gross written premiums and policy fees 35,610) 34,572 3%
Global Life gross written premiums, policy fees and insurance deposits 30,259) 27,711 9%
Farmers Management Services management fees and other related revenues 2,846) 2,767 3%
Farmers Re gross written premiums and policy fees 4,361) 3,529 24%
General Insurance business operating profit 2,097) 2,247 (7%)
General Insurance combined ratio 98.4%) 98.9% 0.5 pts
Governance
Global Life business operating profit 1,338) 1,353 (1%)
Global Life new business annual premium equivalent (APE) 4,030 3 3,992 1%
Global Life new business margin, after tax (as % of APE) 22.1% 3 24.5% (2.5 pts)
Global Life new business value, after tax 890 3 980 (9%)
Farmers business operating profit 1,414) 1,486 (5%)
Farmers Management Services gross management result 1,378) 1,333 3%
Farmers Management Services managed gross earned premium margin 7.3% 4 7.3% –
Average Group investments 203,192) 196,788 3%
Net investment result on Group investments 8,911) 9,367 (5%)
Net investment return on Group investments 5 4.4%) 4.8% (0.4 pts)
Total return on Group investments 5 7.0%) 5.3% 1.7 pts
Shareholders’ equity 34,494) 31,484 10%
Group performance review
Swiss Solvency Test capitalization ratio 6 178%) 183% (5 pts)
Diluted earnings per share (in CHF) 24.66) 22.52 10%
Book value per share (in CHF) 214.79) 202.17 6%
Return on common shareholders’ equity (ROE) 11.8%) 11.9% (0.2 pts)
Business operating profit (after tax) return on common shareholders’ equity (BOPAT ROE) 9.3%) 10.2% (0.9 pts)
1
December 31, 2011 has been restated as set out in note 1 of the Consolidated financial statements.
2
Parentheses around numbers represent an adverse variance.
3
Does not include any contribution from the insurance businesses acquired from Banco Santander S.A. (Zurich Santander) or from the acquisition of Zurich Insurance Malaysia Berhad (ZIMB).
4
Calculated based on gross earned premiums of the Farmers Exchanges of USD 18.8 billion, which excludes the return of USD 74 million in premiums as a result of the anticipated settlement of a lawsuit
with the State of Texas.
5
Calculated on average Group investments.
6
Ratios as of July 1, 2012 and January 1, 2012, respectively, are calculated based on the Group’s internal model which is subject to the review and approval of the Group’s regulator, the Swiss Financial Market
Supervisory Authority (FINMA). The SST Ratio for January 1, 2012 has been restated following FINMA’s review of the Annual SST Report.
Financial information
Operational highlights
• Zurich Santander and Zurich Insurance Malaysia Berhad contributed to Global Life and
General Insurance premium growth
• The Group expanded bank distribution agreements through alliances in the Middle East,
Italy, Spain and Indonesia
• The Farmers Exchanges 1 continue their eastward expansion in the U.S. and strengthen
their network of exclusive agents
1
All references to “Farmers Exchanges” mean Farmers Insurance Exchange, Fire Insurance Exchange, Truck Insurance Exchange and their subsidiaries and affiliates. The three Exchanges are California domiciled
interinsurance exchanges owned by their policyholders with governance oversight by their Boards of Governors.