1 2 3+
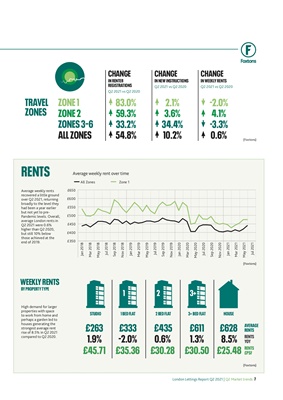
WEEKLY RENTS
BY PROPERTY TYPE
Foxtons
Foxtons
Foxtons
Unless otherwise stated, data is shown for Q1
RENTS ZONE 1
ZONE 2
ZONES 3-6
ALL ZONES
TRAVEL
ZONES
£249
-13.8%
£44.22
£326
-16.3%
£34.15
£423
-12.5%
£28.77
£584
-14.3%
£27.20
£573
-1.6%
£27.01
STUDIO 1 BED FLAT 2 BED FLAT 3+ BED FLAT HOUSE
AVERAGE
RENTS
RENTS
YOY
RENTS
£PSF
All Zones Zone 1
Rents dramatically fell in
2020 and average weekly
rents in Q1 2021 remain
12.4% lower than
last year. Zone 1 has
experienced the largest
annual decrease in rents
at -20.5%. However,
weekly rents in March
2021 saw a monthly
increase of 2.1% in all
zones and an increase
of 3.4% in Zone 1,
suggesting rents are
on the road to recovery.
Q1 2021
Houses had the
smallest annual
decline in weekly rent
in Q1 2021 (-1.6%).
1 bed flats saw the
biggest fall in rents
(-16.1%), which is no
surprise, as many
Londoners continued
to work from home,
requiring more space.
Average weekly rent over time
CHANGE
IN RENTER
REGISTRATIONS
Q1 2021 vs Q1 2020
80.6%
56.5%
54.0%
60.7%
CHANGE
IN WEEKLY RENTS
Q1 2021 vs Q1 2020
-20.5%
-10.4%
-5.4%
-12.4%
CHANGE
IN NEW INSTRUCTIONS
Q1 2021 vs Q1 2020
16.2%
35.7%
19.0%
24.3%
£400
£650
£600
£550
£500
£450
£350
Jan 2018
Mar 2018
May 2018
Jul 2018
Sep 2018
Nov 2018
Jan 2019
Mar 2019
May 2019
Jul 2019
Sep 2019
Nov 2019
Jan 2020
Mar 2020
May 2020
Jul 2020
Sep 2020
Nov 2020
Jan 2021
Mar 2021
London Lettings Report Q1 2021 | Q1 Market trends 7