Power BI Desktop
Low
High
New Renters per New Instruction
Foxtons - Lettings Market
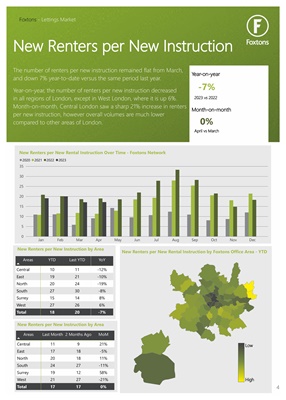
The number of renters per new instruction remained flat from March,
and down 7% year-to-date versus the same period last year.
Year-on-year, the number of renters per new instruction decreased
in all regions of London, except in West London, where it is up 6%.
Month-on-month, Central London saw a sharp 21% increase in renters
per new instruction, however overall volumes are much lower
compared to other areas of London.
New Renters per New Rental Instruction Over Time - Foxtons Network
0
5
10
15
20
25
30
35
Jan Feb Mar Apr May Jun Jul Aug Sep Oct Nov Dec
2020 2021 2022 2023
New Renters per New Rental Instruction by Foxtons Office Area - YTD
-7%
0%
New Renters per New Instruction by Area
Areas
YTD Last YTD YoY
Central
East
North
South
Surrey
West
10
19
20
27
15
27
11
21
24
30
14
26
-12%
-10%
-19%
-8%
8%
6%
Total 18 20 -7%
New Renters per New Instruction by Area
Areas
Last Month 2 Months Ago MoM
Central
East
North
South
Surrey
West
11
17
20
24
19
21
9
18
18
27
12
27
21%
-5%
11%
-11%
58%
-21%
Total 17 17 0%
Year-on-year
Month-on-month
2023 vs 2022
April vs March
4