Low
High
Market New Listings
Foxtons - Lettings Market
Market New Listings by London Borough
Market New Listings Over Time
0K
10K
20K
30K
40K
50K
Jan Feb Mar Apr May Jun Jul Aug Sep Oct Nov Dec
2021 2022 2023 2024
11%
-14%
All market data on this page is from Zoopla. Foxtons data is internal.
Growth in Market New Listings YoY (vs same month last year)
-60%
-40%
-20%
0%
20%
40%
60%
80%
Jan
Feb
Mar
Apr
May
Jun
Jul
Aug
Sep
Oct
Nov
Dec
Jan
Feb
Mar
Apr
May
Jun
Jul
Aug
Sep
Oct
Nov
Dec
Jan
Feb
Mar
Apr
May
Jun
Jul
Aug
Sep
Oct
Nov
Dec
Jan
Feb
Mar
Apr
2021 2022 2023 2024
Year-on-year
Month-on-month
2024 vs 2023
April vs March
6
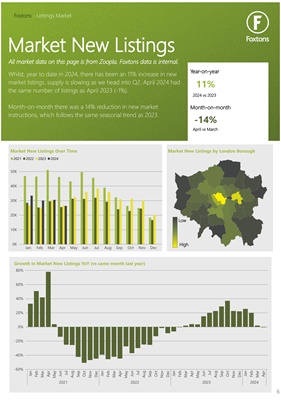
Whilst, year to date in 2024, there has been an 11% increase in new
market listings, supply is slowing as we head into Q2. April 2024 had
the same number of listings as April 2023 (-1%).
Month-on-month there was a 14% reduction in new market
instructions, which follows the same seasonal trend as 2023.