Power BI Desktop
Low
High
New Renters per New Instruction
Foxtons - Lettings Market
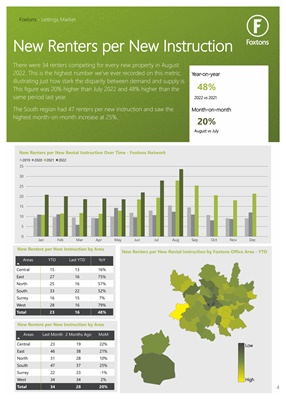
There were 34 renters competing for every new property in August
2022. This is the highest number we've ever recorded on this metric,
illustrating just how stark the disparity between demand and supply is.
This figure was 20% higher than July 2022 and 48% higher than the
same period last year.
The South region had 47 renters per new instruction and saw the
highest month-on-month increase at 25%.
New Renters per New Rental Instruction Over Time - Foxtons Network
0
5
10
15
20
25
30
35
Jan Feb Mar Apr May Jun Jul Aug Sep Oct Nov Dec
2019 2020 2021 2022
New Renters per New Rental Instruction by Foxtons Office Area - YTD
48%
20%
New Renters per New Instruction by Area
Areas
YTD Last YTD YoY
Central
East
North
South
Surrey
West
15
27
25
33
16
28
13
16
16
22
15
16
16%
75%
57%
52%
7%
79%
Total 23 16 48%
New Renters per New Instruction by Area
Areas
Last Month 2 Months Ago MoM
Central
East
North
South
Surrey
West
23
46
31
47
22
34
19
38
28
37
23
34
22%
21%
10%
25%
-1%
2%
Total 34 28 20%
Year-on-year
Month-on-month
2022 vs 2021
August vs July
4