Low
High
New Renters per New Instruction
Foxtons - Lettings Market
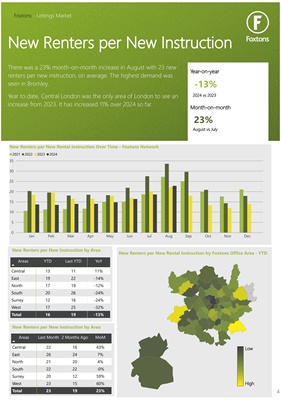
There was a 23% month-on-month increase in August with 23 new
renters per new instruction, on average. The highest demand was
seen in Bromley.
Year to date, Central London was the only area of London to see an
increase from 2023. It has increased 11% over 2024 so far.
New Renters per New Rental Instruction Over Time - Foxtons Network
0
5
10
15
20
25
30
35
Jan Feb Mar Apr May Jun Jul Aug Sep Oct Nov Dec
2021 2022 2023 2024
New Renters per New Rental Instruction by Foxtons Office Area - YTD
-13%
23%
New Renters per New Instruction by Area
Areas
YTD Last YTD YoY
Central 13 11 11%
East 19 22 -14%
North 17 19 -12%
South 20 26 -24%
Surrey 12 16 -24%
West 17 25 -32%
Total 16 19 -13%
New Renters per New Instruction by Area
Areas
Last Month 2 Months Ago MoM
Central 22 16 43%
East 26 24 7%
North 21 20 4%
South 22 22 -0%
Surrey 20 12 59%
West 23 15 60%
Total 23 19 23%
Year-on-year
Month-on-month
2024 vs 2023
August vs July
4