Renter Spend
Average % of Rental Budget Spent
Foxtons - Lettings Market
Average % Renter Budget Spent on Rent Over Time - Foxtons Network
95%
96%
97%
98%
99%
100%
101%
102%
Jan Feb Mar Apr May Jun Jul Aug Sep Oct Nov Dec
2022 2023 2024 2025
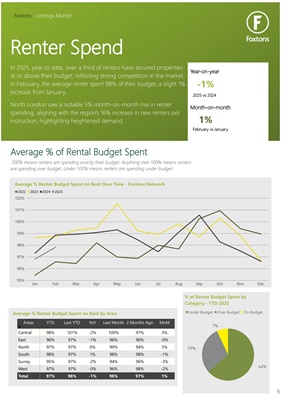
In 2025, year to date, over a third of renters have secured properties
at or above their budget, reflecting strong competition in the market.
In February, the average renter spent 98% of their budget, a slight 1%
increase from January.
North London saw a notable 5% month-on-month rise in renter
spending, aligning with the region's 16% increase in new renters per
instruction, highlighting heightened demand.
Average % Renter Budget Spent on Rent by Area
Areas
YTD Last YTD YoY Last Month 2 Months Ago MoM
Central 98% 101% -2% 100% 97% 3%
East 96% 97% -1% 96% 96% -0%
North 97% 97% 0% 99% 94% 5%
South 98% 97% 1% 98% 98% -1%
Surrey 95% 97% -2% 94% 96% -3%
West 97% 97% -0% 96% 98% -2%
Total 97% 98% -1% 98% 97% 1%
64%
29%
7%
Under Budget Over Budget On Budget
% of Renter Budget Spent by
100% means renters are spending exactly their budget. Anything over 100% means renters
are spending over budget. Under 100% means renters are spending under budget.
-1%
1%
Year-on-year
Month-on-month
2025 vs 2024
February vs January
Category - YTD 2025
8