Low
High
New Renters per New Instruction
Foxtons - Lettings Market
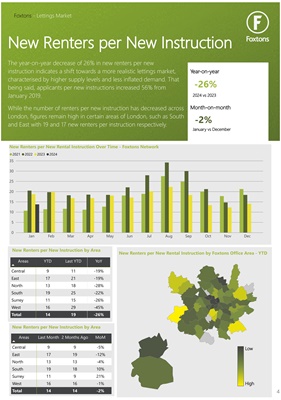
The year-on-year decrease of 26% in new renters per new
instruction indicates a shift towards a more realistic lettings market,
characterised by higher supply levels and less inflated demand. That
being said, applicants per new instructions increased 56% from
January 2019.
While the number of renters per new instruction has decreased across
London, figures remain high in certain areas of London, such as South
and East with 19 and 17 new renters per instruction respectively.
New Renters per New Rental Instruction Over Time - Foxtons Network
0
5
10
15
20
25
30
35
Jan Feb Mar Apr May Jun Jul Aug Sep Oct Nov Dec
2021 2022 2023 2024
New Renters per New Rental Instruction by Foxtons Office Area - YTD
-26%
-2%
New Renters per New Instruction by Area
Areas
YTD Last YTD YoY
Central 9 11 -19%
East 17 21 -19%
North 13 18 -28%
South 19 25 -22%
Surrey 11 15 -26%
West 16 29 -45%
Total 14 19 -26%
New Renters per New Instruction by Area
Areas
Last Month 2 Months Ago MoM
Central 9 9 -5%
East 17 19 -12%
North 13 13 -4%
South 19 18 10%
Surrey 11 9 21%
West 16 16 -1%
Total 14 14 -2%
Year-on-year
Month-on-month
2024 vs 2023
January vs December
4