Low
High
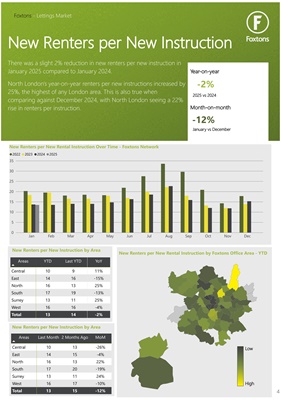
New Renters per New Instruction
Foxtons - Lettings Market
There was a slight 2% reduction in new renters per new instruction in
January 2025 compared to January 2024.
North London's year-on-year renters per new instructions increased by
25%, the highest of any London area. This is also true when
comparing against December 2024, with North London seeing a 22%
rise in renters per instruction.
New Renters per New Rental Instruction Over Time - Foxtons Network
0
5
10
15
20
25
30
35
Jan Feb Mar Apr May Jun Jul Aug Sep Oct Nov Dec
2022 2023 2024 2025
New Renters per New Rental Instruction by Foxtons Office Area - YTD
-2%
-12%
New Renters per New Instruction by Area
Areas
YTD Last YTD YoY
Central 10 9 11%
East 14 16 -15%
North 16 13 25%
South 17 19 -13%
Surrey 13 11 25%
West 16 16 -4%
Total 13 14 -2%
New Renters per New Instruction by Area
Areas
Last Month 2 Months Ago MoM
Central 10 13 -26%
East 14 15 -4%
North 16 13 22%
South 17 20 -19%
Surrey 13 11 24%
West 16 17 -10%
Total 13 15 -12%
Year-on-year
Month-on-month
2025 vs 2024
January vs December
4