1
2
3
Studio
£471
£605
£814
1 bed flat
2 bed flat
3 bed flat
Houses
£785
10%
9%
9%
9%
£378
Rent Achieved
Average Weekly Rent Achieved YTD and YoY Change
Foxtons - Lettings Market
Average Rent Achieved Over Time - Foxtons Network
£350
£400
£450
£500
£550
£600
£650
Jan Feb Mar Apr May Jun Jul Aug Sep Oct Nov Dec
2020 2021 2022 2023 11%
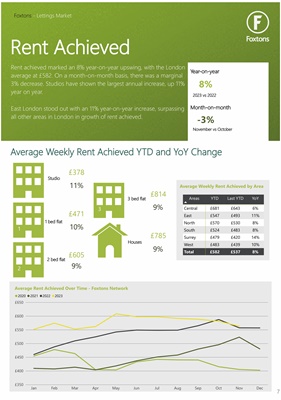
Rent achieved marked an 8% year-on-year upswing, with the London
average at £582. On a month-on-month basis, there was a marginal
3% decrease. Studios have shown the largest annual increase, up 11%
year on year.
East London stood out with an 11% year-on-year increase, surpassing
all other areas in London in growth of rent achieved.
Average Weekly Rent Achieved by Area
Areas
YTD Last YTD YoY
Central £681 £643 6%
East £547 £493 11%
North £570 £530 8%
South £524 £483 8%
Surrey £479 £420 14%
West £483 £439 10%
Total £582 £537 8%
8%
-3%
Year-on-year
Month-on-month
2023 vs 2022
November vs October
7