Power BI Desktop
Low
High
New Renters per New Instruction
Foxtons - Lettings Market
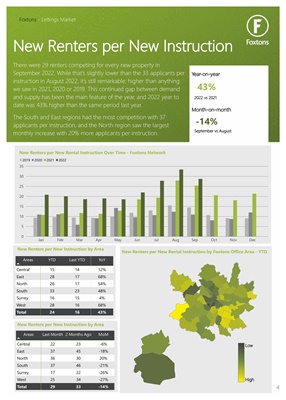
There were 29 renters competing for every new property in
September 2022. While that's slightly lower than the 33 applicants per
instruction in August 2022, it's still remarkable; higher than anything
we saw in 2021, 2020 or 2019. This continued gap between demand
and supply has been the main feature of the year, and 2022 year to
date was 43% higher than the same period last year.
The South and East regions had the most competition with 37
applicants per instruction, and the North region saw the largest
monthly increase with 20% more applicants per instruction.
New Renters per New Rental Instruction Over Time - Foxtons Network
0
5
10
15
20
25
30
35
Jan Feb Mar Apr May Jun Jul Aug Sep Oct Nov Dec
2019 2020 2021 2022
New Renters per New Rental Instruction by Foxtons Office Area - YTD
43%
-14%
New Renters per New Instruction by Area
Areas
YTD Last YTD YoY
Central
East
North
South
Surrey
West
15
28
26
33
16
28
14
17
17
23
15
16
12%
68%
54%
48%
4%
68%
Total 24 16 43%
New Renters per New Instruction by Area
Areas
Last Month 2 Months Ago MoM
Central
East
North
South
Surrey
West
22
37
36
37
17
25
23
45
30
46
22
34
-6%
-18%
20%
-21%
-26%
-27%
Total 29 33 -14%
Year-on-year
Month-on-month
2022 vs 2021
September vs August
4