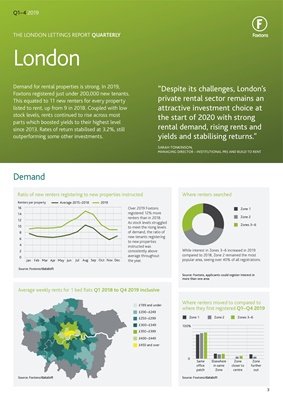
Over 2019 Foxtons
registered 12% more
renters than in 2018.
As stock levels struggled
to meet the rising levels
of demand, the ratio of
new tenants registering
to new properties
instructed was
consistently above
average throughout
the year.
Areas shaded grey
did not have
enough data points
for the period
THE LONDON LETTINGS REPORT QUARTERLY
London
Q1-4 2019
Ratio of new renters registering to new properties instructed
Average weekly rents for 1 bed flats Q1 2018 to Q4 2019 inclusive
12
16
14
Average 2015-2018
Renters per property 2019
Source: Foxtons/dataloft
10
8
6
2
4
0
Jan Feb Mar Apr May Jun Jul Aug Sep Oct Nov Dec
£199 and under
£200-£249
£250-£299
£300-£349
£350-£399
£400-£449
£450 and over
Source: Foxtons/dataloft
Demand for rental properties is strong. In 2019,
Foxtons registered just under 200,000 new tenants.
This equated to 11 new renters for every property
listed to rent, up from 9 in 2018. Coupled with low
stock levels, rents continued to rise across most
parts which boosted yields to their highest level
since 2013. Rates of return stabilised at 3.2%, still
outperforming some other investments.
"Despite its challenges, London's
private rental sector remains an
attractive investment choice at
the start of 2020 with strong
rental demand, rising rents and
yields and stabilising returns."
SARAH TONKINSON,
MANAGING DIRECTOR - INSTITUTIONAL PRS AND BUILD TO RENT
Where renters searched
Where renters moved to compared to
where they first registered Q1-Q4 2019
Zone 1
Zone 1
Zone 2
Zone 2
Zones 3-6
Zones 3-6
While interest in Zones 3-6 increased in 2019
compared to 2018, Zone 2 remained the most
popular area, seeing over 40% of all registrations.
Source: Foxtons, applicants could register interest in
more than one area
100%
Source: Foxtons/dataloft
0
Same
office
patch
Elsewhere
in same
Zone
Zone
closer to
centre
Zone
further
out
Demand
3