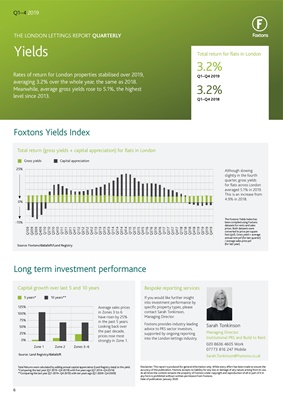
Although slowing
slightly in the fourth
quarter, gross yields
for flats across London
averaged 5.1% in 2019.
This is an increase from
4.9% in 2018.
Average sales prices
in Zones 3 to 6
have risen by 25%
in the past 5 years.
Looking back over
the past decade,
prices rose most
strongly in Zone 1.
If you would like further insight
into investment performance by
specific property types, please
contact Sarah Tonkinson,
Managing Director.
Foxtons provides industry leading
advice to PRS sector investors,
supported by ongoing reporting
into the London lettings industry.
THE LONDON LETTINGS REPORT QUARTERLY
Yields
Rates of return for London properties stabilised over 2019,
averaging 3.2% over the whole year, the same as 2018.
Meanwhile, average gross yields rose to 5.1%, the highest
level since 2013.
3.2%
3.2%
Total return for flats in London
Q1-Q4 2019
Q1-Q4 2018
Sarah Tonkinson
Managing Director
Institutional PRS and Build to Rent
020 8636 4605 Work
07773 816 247 Mobile
sarah.tonkinson@foxtons.co.uk
125%
100%
50%
75%
0%
25%
6 Total return (gross yields + capital appreciation) for flats in London
Capital growth over last 5 and 10 years
25%
Source: Foxtons/dataloft/Land Registry
Source: Land Registry/dataloft
Zone 1 Zone 2 Zones 3-6
0%
-15%
Foxtons Yields Index
Long term investment performance
Bespoke reporting services
5 years*
Gross yields
10 years**
Capital appreciation
Q109
Q209
Q309
Q409
Q110
Q210
Q310
Q410
Q111
Q211
Q311
Q411
Q112
Q212
Q312
Q412
Q113
Q213
Q313
Q413
Q114
Q214
Q314
Q414
Q115
Q215
Q315
Q415
Q116
Q216
Q316
Q416
Q117
Q217
Q317
Q417
Q118
Q218
Q318
Q418
Q119
Q219
Q319
Q419
Q1-4 2019
Disclaimer: This report is produced for general information only. While every effort has been made to ensure the
accuracy of this publication, Foxtons accepts no liability for any loss or damage of any nature arising from its use.
At all times the content remains the property of Foxtons under copyright and reproduction of all or part of it in
any form is prohibited without written permission from Foxtons.
Date of publication: January 2020
Total Returns were calculated by adding annual capital appreciation (Land Registry data) to the yield.
*Comparing the last year (Q1 2019-Q4 2019) with five years ago (Q1 2014-Q4 2014)
**Comparing the last year (Q1 2019-Q4 2019) with ten years ago (Q1 2009-Q4 2009)
The Foxtons Yields Index has
been compiled using Foxtons
datasets for rents and sales
prices. Both datasets were
converted to price per square
foot (psf). Gross yield = average
annual rent psf (for last quarter)
/ average sales price psf
(for last year).