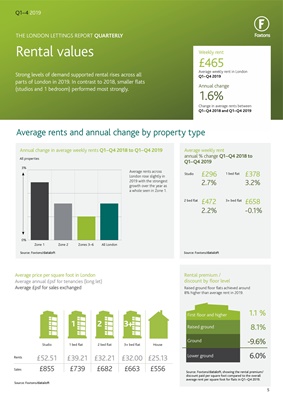
Average rents across
London rose slightly in
2019 with the strongest
growth over the year as
a whole seen in Zone 1.
THE LONDON LETTINGS REPORT QUARTERLY
Rental values
Strong levels of demand supported rental rises across all
parts of London in 2019. In contrast to 2018, smaller flats
(studios and 1 bedroom) performed most strongly.
£465
1.6%
Annual change
Weekly rent
Average weekly rent in London
Q1-Q4 2019
Change in average rents between
Q1-Q4 2018 and Q1-Q4 2019
Source: Foxtons/dataloft
All properties
5
£296 £378
£472 £658
2.7% 3.2%
2.2% -0.1%
Annual change in average weekly rents Q1-Q4 2018 to Q1-Q4 2019
Average price per square foot in London
Average annual £psf for tenancies (long let)
Average £psf for sales exchanged
Rental premium /
discount by floor level
Source: Foxtons/dataloft
Source: Foxtons/dataloft
Zone 1 Zone 2 Zones 3-6 All London
3%
Average rents and annual change by property type
Average weekly rent
annual % change Q1-Q4 2018 to
Q1-Q4 2019
Raised ground floor flats achieved around
8% higher than average rent in 2019.
Source: Foxtons/dataloft, showing the rental premium/
discount paid per square foot compared to the overall
average rent per square foot for flats in Q1-Q4 2019.
1 bed flat
2 bed flat 3+ bed flat
Q1-4 2019
1 2 3+
£52.51
£855
£39.21
£739
£32.21
£682
£32.00
£663
£25.13
£556
Studio 1 bed flat 2 bed flat 3+ bed flat House
Rents
Sales
Lower ground
Ground
Raised ground
First floor and higher 1.1 %
8.1%
-9.6%
6.0%
0%
Studio