Overall tenant
registrations in the first
quarter of 2020 were
just 5% lower than the
first quarter of 2019.
However, a 26% fall in
March compared to a
year earlier led to a fall in
the ratio of new tenants
registering to new
properties instructed.
Areas shaded grey
did not have
enough data points
for the period
THE LONDON LETTINGS REPORT QUARTERLY
London
Q1 2020
Ratio of new renters registering to new properties instructed
Average weekly rents for 1 bed flats Q1 2019 to Q1 2020 inclusive
12
16
14
Average 2015-2019
Renters per property 2020
Source: Foxtons/dataloft
10
8
6
2
4
0
Jan Feb Mar Apr May Jun Jul Aug Sep Oct Nov Dec
£199 and under
£200-£249
£250-£299
£300-£349
£350-£399
£400-£449
£450 and over
Source: Foxtons/dataloft
"The first quarter of 2020 saw a strong start for the lettings market with
a rise in demand for rental properties in London. The current climate has
naturally halted this demand curve as tenants renew contracts on existing
properties and extend tenancies until they are in a more stable situation.
We expect to gain insight into the extent of the impact of this in the data
for the second quarter of the year."
SARAH TONKINSON,
MANAGING DIRECTOR - INSTITUTIONAL PRS AND BUILD TO RENT
Where renters searched
Where renters moved to compared to
where they first registered Q1 2020
Zone 1
Zone 1
Zone 2
Zone 2
Zones 3-6
Zones 3-6
Where renters searched for properties in Q1 2020
was fairly consistent with Q1 2019, with a slight
increase in interest in Zone 2.
Source: Foxtons, applicants could register interest in
more than one area
100%
Source: Foxtons/dataloft
0
Same
office
patch
Elsewhere
in same
Zone
Zone
closer to
centre
Zone
further
out
Demand
3
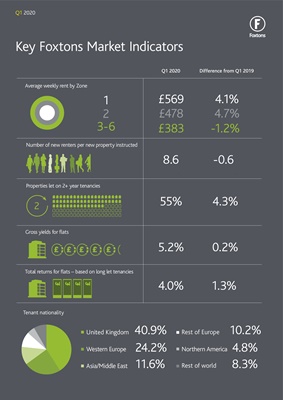
Key Foxtons Market Indicators
1
2
3-6
2
£569 4.1%
£478 4.7%
£383 -1.2%
Average weekly rent by Zone
Number of new renters per new property instructed
Properties let on 2+ year tenancies
Gross yields for flats
Total returns for flats - based on long let tenancies
Q1 2020 Difference from Q1 2019
8.6 -0.6
55% 4.3%
5.2% 0.2%
4.0% 1.3%
40.9%
24.2%
11.6%
10.2%
4.8%
8.3%
Northern America
Rest of world
United Kingdom
Western Europe
Asia/Middle East
Rest of Europe
Tenant nationality
Q1 2020