As this report goes to print, the government is managing acute inflationary
pressures at home through the mechanism of interest rate rises, while
addressing the threat of global political instability. By all conventional
measures, the UK is facing severe challenges to its economy and its housing
market and yet London rents have never risen more steeply.
Finding perspective
To try and make sense of the extraordinary
conditions in today's London rental market,
we took a forward look at what lies ahead
for the economy over the next year and a
backward look at the key housing market
indicators spanning half a century. The
consensus view is that inflation will settle
and GDP growth will be minimal next
year, while the current cycle of house
price growth is widely expected to end.
Over the long term, there remains a
striking contrast between the volatility of
house price growth, and the relative
stability of rents.
Rental stability
For renters, the connection between
earnings and monthly rental commitments
is very real and direct. Rents have tracked
earnings closely and consistently over
time. The average rental growth since
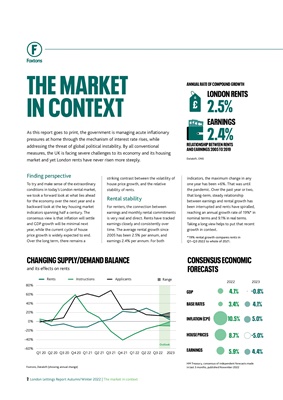
2005 has been 2.5% per annum, and
earnings 2.4% per annum. For both
indicators, the maximum change in any
one year has been +6%. That was until
the pandemic. Over the past year or two,
that long-term, steady relationship
between earnings and rental growth has
been interrupted and rents have spiralled,
reaching an annual growth rate of 19%* in
nominal terms and 9.1% in real terms.
Taking a long view helps to put that recent
growth in context.
2 London Lettings Report Autumn/Winter 2022 | The market in context
GDP 4.1% -0.8%
3.4% 4.1%
10.5% 5.0%
8.7% -5.0%
5.9% 4.4%
BASE RATES
INFLATION (CPI)
HOUSE PRICES
EARNINGS
THE MARKET
IN CONTEXT
Foxtons, Dataloft (showing annual change)
HM Treasury, consensus of independent forecasts made
in last 3 months, published November 2022
CHANGING SUPPLY/DEMAND BALANCE CONSENSUS ECONOMIC
FORECASTS
and its effects on rents
Rents Instructions Applicants
2022 2023
20%
40%
60%
80%
-20%
0%
-40%
-60% Q1 20 Q1 21 Q1 22
Q2 20 Q2 21 Q2 22
Q3 20 Q3 21 Q3 22
Q4 20 Q4 21 2023
Outlook
Range
EARNINGS
2.4%
LONDON RENTS
2.5%
RELATIONSHIP BETWEEN RENTS
AND EARNINGS 2005 TO 2019
ANNUAL RATE OF COMPOUND GROWTH
Dataloft, ONS
*19% rental growth compares rents in
Q1-Q3 2022 to whole of 2021.