1 2 3+
Jan 2018
Mar 2018
May 2018
Jul 2018
Sep 2018
Nov 2018
Jan 2019
Mar 2019
May 2019
Jul 2019
Sep 2019
Nov 2019
Jan 2020
Mar 2020
May 2020
Jul 2020
Sep 2020
Nov 2020
Jan 2021
Mar 2021
May 2021
Jul 2021
Sep 2021
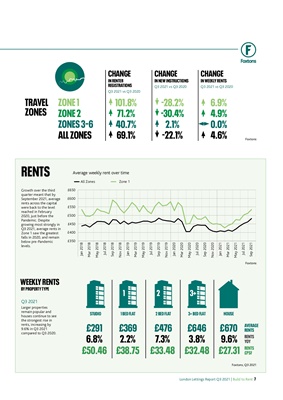
WEEKLY RENTS
BY PROPERTY TYPE
Foxtons
Foxtons
Foxtons, Q3 2021
RENTS ZONE 1
ZONE 2
ZONES 3-6
ALL ZONES
TRAVEL
ZONES
£291
6.8%
£50.46
£369
2.2%
£38.75
£476
7.3%
£33.48
£646
3.8%
£32.48
£670
9.6%
£27.31
STUDIO 1 BED FLAT 2 BED FLAT 3+ BED FLAT HOUSE
AVERAGE
RENTS
RENTS
YOY
RENTS
£PSF
All Zones Zone 1
Growth over the third
quarter meant that by
September 2021, average
rents across the capital
were back to the level
reached in February
2020, just before the
Pandemic. Despite
growing most strongly in
Q3 2021, average rents in
Zone 1 saw the greatest
falls in 2020, and remain
below pre-Pandemic
levels.
Q3 2021
Larger properties
remain popular and
houses continue to see
the strongest rise in
rents, increasing by
9.6% in Q3 2021
compared to Q3 2020.
Average weekly rent over time
CHANGE
IN RENTER
REGISTRATIONS
Q3 2021 vs Q3 2020
101.8%
71.2%
40.7%
69.1%
CHANGE
IN WEEKLY RENTS
Q3 2021 vs Q3 2020
6.9%
4.9%
0.0%
4.6%
CHANGE
IN NEW INSTRUCTIONS
Q3 2021 vs Q3 2020
-28.2%
-30.4%
2.1%
-22.1%
£400
£650
£600
£550
£500
£450
£350
London Lettings Report Q3 2021 | Build to Rent 7