Power BI Desktop
Renter Spend
Average % of Rental Budget Spent
Foxtons - Lettings Market
Average % Renter Budget Spent on Rent Over Time - Foxtons Network
90%
95%
100%
Jan Feb Mar Apr May Jun Jul Aug Sep Oct Nov Dec
2019 2020 2021 2022
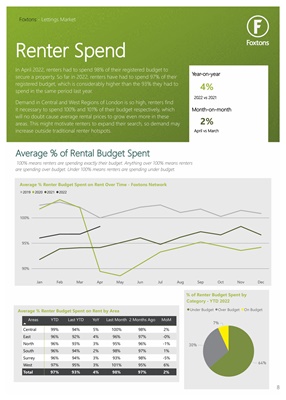
In April 2022, renters had to spend 98% of their registered budget to
secure a property. So far in 2022, renters have had to spend 97% of their
registered budget, which is considerably higher than the 93% they had to
spend in the same period last year.
Demand in Central and West Regions of London is so high, renters find
it necessary to spend 100% and 101% of their budget respectively, which
will no doubt cause average rental prices to grow even more in these
areas. This might motivate renters to expand their search, so demand may
increase outside traditional renter hotspots.
Average % Renter Budget Spent on Rent by Area
Areas
YTD Last YTD YoY Last Month 2 Months Ago MoM
Central
East
North
South
Surrey
West
99%
96%
96%
96%
96%
97%
94%
92%
93%
94%
94%
95%
5%
4%
3%
2%
3%
3%
100%
96%
95%
98%
93%
101%
98%
97%
96%
97%
98%
95%
2%
-0%
-1%
1%
-5%
6%
Total 97% 93% 4% 98% 97% 2%
64%
30%
7%
Under Budget Over Budget On Budget
% of Renter Budget Spent by
100% means renters are spending exactly their budget. Anything over 100% means renters
are spending over budget. Under 100% means renters are spending under budget.
4%
2%
Year-on-year
Month-on-month
2022 vs 2021
April vs March
Category - YTD 2022
8