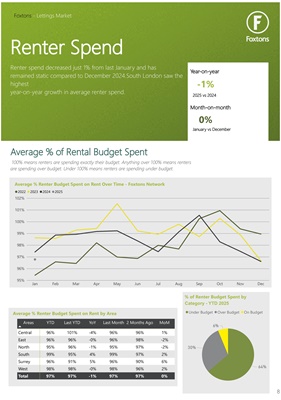
Renter Spend
Average % of Rental Budget Spent
Foxtons - Lettings Market
Average % Renter Budget Spent on Rent Over Time - Foxtons Network
95%
96%
97%
98%
99%
100%
101%
102%
Jan Feb Mar Apr May Jun Jul Aug Sep Oct Nov Dec
2022 2023 2024 2025
Renter spend decreased just 1% from last January and has
remained static compared to December 2024.South London saw the
highest
year-on-year growth in average renter spend.
Average % Renter Budget Spent on Rent by Area
Areas
YTD Last YTD YoY Last Month 2 Months Ago MoM
Central 96% 101% -4% 96% 96% 1%
East 96% 96% -0% 96% 98% -2%
North 95% 96% -1% 95% 97% -2%
South 99% 95% 4% 99% 97% 2%
Surrey 96% 91% 5% 96% 90% 6%
West 98% 98% -0% 98% 96% 2%
Total 97% 97% -1% 97% 97% 0%
64%
30%
6%
Under Budget Over Budget On Budget
% of Renter Budget Spent by
100% means renters are spending exactly their budget. Anything over 100% means renters
are spending over budget. Under 100% means renters are spending under budget.
-1%
0%
Year-on-year
Month-on-month
2025 vs 2024
January vs December
Category - YTD 2025
8