Power BI Desktop
Low
High
New Renters per New Instruction
Foxtons - Lettings Market
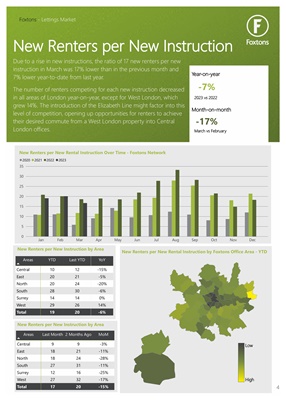
Due to a rise in new instructions, the ratio of 17 new renters per new
instruction in March was 17% lower than in the previous month and
7% lower year-to-date from last year.
The number of renters competing for each new instruction decreased
in all areas of London year-on-year, except for West London, which
grew 14%. The introduction of the Elizabeth Line might factor into this
level of competition, opening up opportunities for renters to achieve
their desired commute from a West London property into Central
London offices.
New Renters per New Rental Instruction Over Time - Foxtons Network
0
5
10
15
20
25
30
35
Jan Feb Mar Apr May Jun Jul Aug Sep Oct Nov Dec
2020 2021 2022 2023
New Renters per New Rental Instruction by Foxtons Office Area - YTD
-7%
-17%
New Renters per New Instruction by Area
Areas
YTD Last YTD YoY
Central
East
North
South
Surrey
West
10
20
20
28
14
29
12
21
24
30
14
26
-15%
-5%
-20%
-6%
0%
14%
Total 19 20 -6%
New Renters per New Instruction by Area
Areas
Last Month 2 Months Ago MoM
Central
East
North
South
Surrey
West
9
18
18
27
12
27
9
21
24
31
16
32
-3%
-11%
-28%
-11%
-25%
-17%
Total 17 20 -15%
Year-on-year
Month-on-month
2023 vs 2022
March vs February
4