Power BI Desktop
1
2
3
Studio
£451
£577
£824
1 bed flat
2 bed flat
3 bed flat
Houses
£740
15%
12%
22%
13%
£353
Rent Achieved
Average Weekly Rent Achieved YTD and YoY Change
Foxtons - Lettings Market
Average Rent Achieved Over Time - Foxtons Network
£350
£400
£450
£500
£550
£600
£650
Jan Feb Mar Apr May Jun Jul Aug Sep Oct Nov Dec
2020 2021 2022 2023 16%
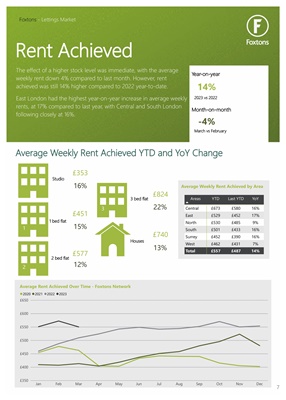
The effect of a higher stock level was immediate, with the average
weekly rent down 4% compared to last month. However, rent
achieved was still 14% higher compared to 2022 year-to-date.
East London had the highest year-on-year increase in average weekly
rents, at 17% compared to last year, with Central and South London
following closely at 16%.
Average Weekly Rent Achieved by Area
Areas
YTD Last YTD YoY
Central
East
North
South
Surrey
West
£673
£529
£530
£501
£452
£462
£580
£452
£485
£433
£390
£431
16%
17%
9%
16%
16%
7%
Total £557 £487 14%
14%
-4%
Year-on-year
Month-on-month
2023 vs 2022
March vs February
7