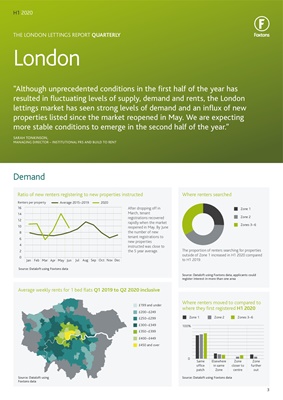
After dropping off in
March, tenant
registrations recovered
rapidly when the market
reopened in May. By June
the number of new
tenant registrations to
new properties
instructed was close to
the 5 year average.
Areas shaded grey
did not have
enough data points
for the period
THE LONDON LETTINGS REPORT QUARTERLY
London
H1 2020
Ratio of new renters registering to new properties instructed
Average weekly rents for 1 bed flats Q1 2019 to Q2 2020 inclusive
12
16
14
Average 2015-2019
Renters per property 2020
Source: Dataloft using Foxtons data
10
8
6
2
4
0
Jan Feb Mar Apr May Jun Jul Aug Sep Oct Nov Dec
£199 and under
£200-£249
£250-£299
£300-£349
£350-£399
£400-£449
£450 and over
Source: Dataloft using
Foxtons data
"Although unprecedented conditions in the first half of the year has
resulted in fluctuating levels of supply, demand and rents, the London
lettings market has seen strong levels of demand and an influx of new
properties listed since the market reopened in May. We are expecting
more stable conditions to emerge in the second half of the year."
SARAH TONKINSON,
MANAGING DIRECTOR - INSTITUTIONAL PRS AND BUILD TO RENT
Where renters searched
Where renters moved to compared to
where they first registered H1 2020
Zone 1
Zone 1
Zone 2
Zone 2
Zones 3-6
Zones 3-6
The proportion of renters searching for properties
outside of Zone 1 increased in H1 2020 compared
to H1 2019.
Source: Dataloft using Foxtons data, applicants could
register interest in more than one area
100%
Source: Dataloft using Foxtons data
0
Same
office
patch
Elsewhere
in same
Zone
Zone
closer to
centre
Zone
further
out
Demand
3