Power BI Desktop
Low
High
New Renters per New Instruction
Foxtons - Lettings Market
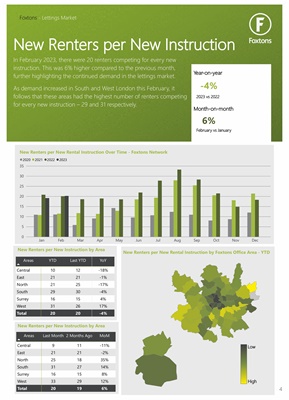
In February 2023, there were 20 renters competing for every new
instruction. This was 6% higher compared to the previous month,
further highlighting the continued demand in the lettings market.
As demand increased in South and West London this February, it
follows that these areas had the highest number of renters competing
for every new instruction - 29 and 31 respectively.
New Renters per New Rental Instruction Over Time - Foxtons Network
0
5
10
15
20
25
30
35
Jan Feb Mar Apr May Jun Jul Aug Sep Oct Nov Dec
2020 2021 2022 2023
New Renters per New Rental Instruction by Foxtons Office Area - YTD
-4%
6%
New Renters per New Instruction by Area
Areas
YTD Last YTD YoY
Central
East
North
South
Surrey
West
10
21
21
29
16
31
12
21
25
30
15
26
-18%
-1%
-17%
-4%
4%
17%
Total 20 20 -4%
New Renters per New Instruction by Area
Areas
Last Month 2 Months Ago MoM
Central
East
North
South
Surrey
West
9
21
25
31
16
33
11
21
18
27
15
29
-11%
-2%
35%
14%
8%
12%
Total 20 19 6%
Year-on-year
Month-on-month
2023 vs 2022
February vs January
4