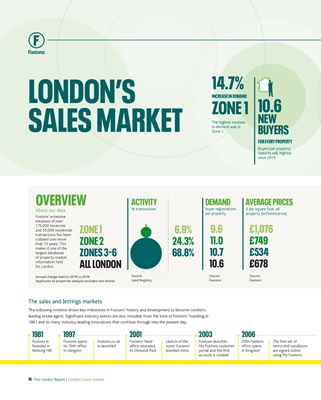
AVERAGE PRICES
6.9%
24.3%
68.8%
OVERVIEW
ZONE 1
ZONE 2
ZONES 3-6
ALL LONDON
9.6
11.0
10.7
10.6
DEMAND
ACTIVITY AVERAGE PRICES
£1,076
£749
£534
£678
buyer registrations
per property
% transactions £ per square foot, all
property (achieved price)
10.6
NEW
BUYERS
FOR EVERY PROPERTY
Buyers per property
listed to sell, highest
since 2013.
2001 2003 2006
1981 1997
Foxtons.co.uk
is launched
Launch of the
iconic Foxtons'
branded minis
The first set of
terms and conditions
are signed online
using My Foxtons
Foxtons' head
office relocated
to Chiswick Park
Foxtons launches
My Foxtons customer
portal and the first
account is created
20th Foxtons
office opens
in Kingston
Foxtons is
founded in
Notting Hill
Foxtons opens
its 10th office
in Islington
The sales and lettings markets
The following timeline shows key milestones in Foxtons' history and development to become London's
leading estate agent. Significant industry events are also included, from the time of Foxtons' founding in
1981 and its many industry-leading innovations that continue through into the present day.
ZONE 1
14.7%INCREASE IN DEMAND
The highest increase
in demand was in
Zone 1.
About our data
Foxtons' extensive
database of over
175,000 tenancies
and 55,000 residential
transactions has been
collated over more
than 15 years. This
makes it one of the
largest databases
of property market
information held
for London.
Land Registry Foxtons
Annual change metrics 2019 vs 2018
Applicants to properties analysis excludes new homes
Foxtons
LONDON'S
SALES MARKET
Source:
Land Registry
Source:
Foxtons
Source:
Foxtons
14 The London Report | London's sales market