SUPPLY DEMAND AVERAGE RENTS
-13.1%
-8.0%
-12.4%
-10.6%
5.0%
13.2%
3.2%
12.3%
2.5%
1.6%
1.0%
1.6%
change in new
instructions
change in tenant
registrations
average rental price
achieved
Foxtons Foxtons Foxtons
Annual change
15%
20%
10%
5%
0%
-5%
-10%
-15%
-20%
Supply Demand Rents
Foxtons, showing year on year change
*Total returns for flats in London in 2019, Foxtons
2015 2017
2016 2018 2019
ANNUAL CHANGE METRICS (2019 VS 2018)
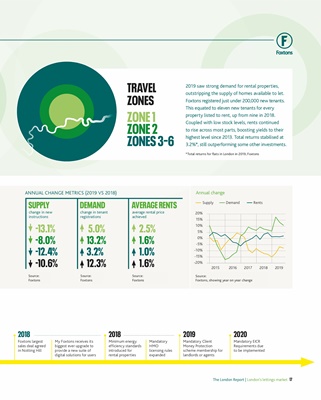
2019 saw strong demand for rental properties,
outstripping the supply of homes available to let.
Foxtons registered just under 200,000 new tenants.
This equated to eleven new tenants for every
property listed to rent, up from nine in 2018.
Coupled with low stock levels, rents continued
to rise across most parts, boosting yields to their
highest level since 2013. Total returns stabilised at
3.2%*, still outperforming some other investments.
ZONE 1
ZONE 2
ZONES 3-6
TRAVEL
ZONES
2018 2019 2020
Minimum energy
efficiency standards
introduced for
rental properties
Mandatory Client
Money Protection
scheme membership for
landlords or agents
Mandatory EICR
Requirements due
to be implemented
Mandatory
HMO
licensing rules
expanded
My Foxtons receives its
biggest ever upgrade to
provide a new suite of
digital solutions for users
2018
Foxtons largest
sales deal agreed
in Notting Hill
Source:
Foxtons
Source:
Foxtons, showing year on year change
Source:
Foxtons
Source:
Foxtons
The London Report | London's lettings market 17