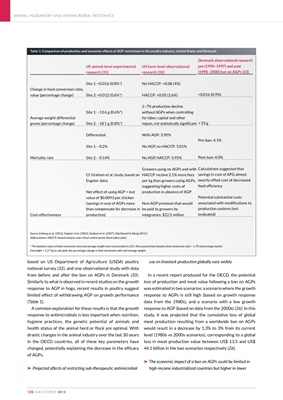
based on US Department of Agriculture (USDA) poultry
national survey (32), and one observational study with data
from before and after the ban on AGPs in Denmark (33).
Similarly to what is observed in recent studies on the growth
response to AGP in hogs, recent results in poultry suggest
limited effect of withdrawing AGP on growth performance
(Table 1).
A common explanation for these results is that the growth
response to antimicrobials is less important when nutrition,
hygiene practices, the genetic potential of animals and
health status of the animal herd or flock are optimal. With
drastic changes in the animal industry over the last 30 years
in the OECD countries, all of these key parameters have
changed, potentially explaining the decrease in the efficacy
of AGPs.
‰ Projected effects of restricting sub-therapeutic antimicrobial
use on livestock production globally vary widely
In a recent report produced for the OECD, the potential
loss of production and meat value following a ban on AGPs
was estimated in two scenarios: a scenario where the growth
response to AGPs is still high (based on growth response
data from the 1980s), and a scenario with a low growth
response to AGP (based on data from the 2000s) (26). In this
study, it was projected that the cumulative loss of global
meat production resulting from a worldwide ban on AGPs
would result in a decrease by 1.3% to 3% from its current
level (1980s vs 2000s scenarios), corresponding to a global
loss in meat production value between US$ 13.5 and US$
44.1 billion in the two scenarios respectively (26).
‰ The economic impact of a ban on AGPs could be limited in
high-income industrialized countries but higher in lower
ANIMAL HUSBANDRY AND ANTIMICROBIAL RESISTANCE
120 AMR CONTROL 2015
Table 1: Comparison of production and economic effects of AGP restrictions in the poultry industry, United States and Denmark
Change in feed conversion ratio,
value (percentage change)
Average weight differential
grams (percentage change)
Mortality rate
Cost-effectiveness
US animal-level experimental
research (31)
Site 1: +0.016 (0.8%*)
Site 2: +0.012 (0.6%*)
Site 1: -13.6 g (0.6%*)
Site 2: -18.1 g (0.8%*)
Differential:
Site 1: -0.2%
Site 2: -0.14%
Cf. Graham et al. study, based on
Engster data:
Net effect of using AGP = lost
value of $0.0093 per chicken
(savings in cost of AGPs more
than compensate for decrease in
production)
US farm-level observational
research (32)
No HACCP: +0.08 (4%)
HACCP: +0.05 (2.6%)
2-7% production decline
without AGPs when controlling
for labor, capital and other
inputs, not statistically significant
With AGP: 3.95%
No AGP, no HACCP: 5.01%
No AGP, HACCP: 3.95%
Growers using no AGPs and with
HACCP receive 2.1% more fees
per kg than growers using AGPs,
suggesting higher costs of
production in absence of AGP
Non-AGP premium that would
be paid to growers by
integrators: $22.5 million
Denmark observational research
pre (1994-1997) and post
(1998-2000) ban on AGPs (33)
+0.016 (0.9%)
+ 53 g
Pre-ban: 4.1%
Post-ban: 4.0%
Calculations suggested that
savings in cost of APG almost
exactly offset cost of decreased
feed efficiency
Potential substantial costs
associated with modifications to
production systems (not
evaluated)
Source: Emborg et al. (2001), Engster et al. (2002), Graham et al. (2007), MacDonald & Wang (2011)
Abbreviations: HACCP, hazard analysis and critical control points (food safety plan).
* The baseline values of feed conversion ratio and average weight were not provided in (31). We assumed that baseline feed conversion ratio = 1.95 and average market
liveweight = 2.27 kg to calculate the percentage change in feed conversion ratio and average weight.