confers high-level resistance to isoniazid (26, 27). Catalase
activity is essential in activating isoniazid to the active
hydrazine derivative. A deficiency in enzyme activity
produces high-level resistance and is found in more than
80% of isoniazid-resistant strains (28). Alternatively, lowlevel
resistance can be caused by point mutations in the
regulatory region of inhA operon, resulting in over
expression of inhA. Strains with this mutation have normal
mycolic acid synthesis but low-level resistance to isoniazid.
Point mutations in the regulatory region of ahpC have also
been demonstrated; these are a compensation for the
effects of absent or reduced catalase (KatG) function and do
not directly result in resistance (29, 30). Most pyrazinamideresistant
organisms have mutations in the pyrazinamidase
gene, although the gene may also be inactivated through the
insertion of IS6110 (31). Pyrazinamide is essential in
producing the active pyrazinoic acid derivative, and mutants
are unable to produce an active drug. In addition to this,
some resistant strains have no defined mutation (32). The
rate at which resistance emerges differs for all of the antituberculosis
agents, being highest for ethambutol and
lowest for rifampicin and quinolones. The risks of mutation
for most of the antibiotics used in tuberculosis treatment
have been defined previously (33); for rifampicin, isoniazid,
streptomycin, and ethambutol, they are 3.32 × 10⁻⁹, 2.56 ×
10−8, 2.29 × 10⁻⁸, and 1.0 × 10⁻⁷ mutations per bacterium per
cell division, respectively. The mutation rate, rather than the
mutation frequency, is the most reliable measure, as it
records the risk of mutation per cell division rather than the
proportion of mutant cells.
It has been assumed that the risk that an organism will
develop resistance to two agents is the product of the risks
of developing resistance to each separately. For example the
resistance risk for a combination of rifampicin, streptomycin,
and isoniazid is10−25/bacterium/generation.
Global anti-Tuberculosis Drug Resistance
Surveillance Project
In 1993, Tuberculosis was declared as a global emergency
following which, in 1994, the Global Project on AntiTuberculosis
Drug Resistance Surveillance was initiated by
the World Health Organzation (WHO) and International
Union against Tuberculosis and Lung Diseases, aiming to
measure the magnitude of drug resistant tuberculosis and to
monitor trends (34). Since 1994, five global reports on antituberculosis
drug resistance surveillance have been
published (35-39). Drug resistance data have been
systematically collected and analysed from 114 countries
(59% of all countries of the world).
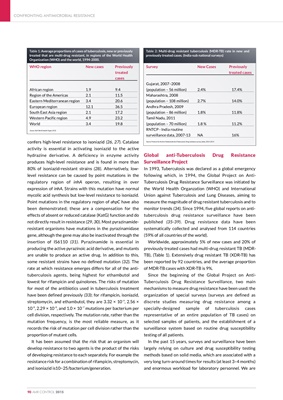
Worldwide, approximately 5% of new cases and 20% of
previously treated cases had multi-drug resistant TB (MDRTB),
(Table 1). Extensively drug resistant TB (XDR-TB) has
been reported by 92 countries, and the average proportion
of MDR-TB cases with XDR-TB is 9%.
Since the beginning of the Global Project on AntiTuberculosis
Drug Resistance Surveillance, two main
mechanisms to measure drug resistance have been used: the
organization of special surveys (surveys are defined as
discrete studies measuring drug resistance among a
specially-designed sample of tuberculosis cases
representative of an entire population of TB cases) on
selected samples of patients, and the establishment of a
surveillance system based on routine drug susceptibility
testing of all patients.
In the past 15 years, surveys and surveillance have been
largely relying on culture and drug susceptibility testing
methods based on solid media, which are associated with a
very long turn-around times for results (at least 3-4 months)
and enormous workload for laboratory personnel. We are
CONFRONTING ANTIMICROBIAL RESISTANCE
90 AMR CONTROL 2015
Table 1: Average proportions of cases of tuberculosis, new or previously
treated that are multi-drug resistant, in regions of the World Health
Organization (WHO) and the world, 1994-2000.
WHO region New cases Previously
treated
cases
African region 1.9 9.4
Region of the Americas 2.1 11.5
Eastern Mediterranean region 3.4 20.6
European region 12.1 36.5
South East Asia region 2.1 17.2
Western Pacific region 4.9 23.2
World 3.4 19.8
Source: Bull World Health Organ 2012
Table 2: Multi-drug resistant tuberculosis (MDR-TB) rate in new and
previously treated cases. (India-sub national surveys)
Survey New Cases Previously
treated cases
Gujarat, 2007-2008
(population - 56 million) 2.4% 17.4%
Maharashtra, 2008
(population - 108 million) 2.7% 14.0%
Andhra Pradesh, 2009
(population - 86 million) 1.8% 11.8%
Tamil Nadu, 2011
(population - 70 million) 1.8 % 11.2%
RNTCP - India routine
surveillance data, 2007-13 NA 16%
Source: Protocol for the first Nationwide Anti-Tuberculosis Drug resistance survey, India, 2014-2015