How do we Measure the Improvement Produced by
our Small Scale Test of Change?
The system can only hope to improve what it measures. For many
improvement projects, an annotated run chart is all that is needed
to learn whether the changes made have led to an improvement
in the measure of interest. If the changes have led to a new level
of system performance, the run chart will provide the evidence
required to claim an improvement1.
Why do we use run charts?
• To show how well a process is performing
• They help determine over time when changes are truly
improvements by displaying a pattern of data that you can
observe as you make changes.
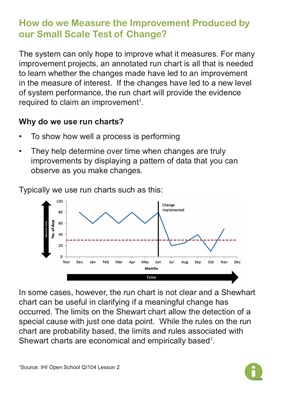
Typically we use run charts such as this:
In some cases, however, the run chart is not clear and a Shewhart
chart can be useful in clarifying if a meaningful change has
occurred. The limits on the Shewart chart allow the detection of a
special cause with just one data point. While the rules on the run
chart are probability based, the limits and rules associated with
Shewart charts are economical and empirically based1.
1Source: IHI Open School QI104 Lesson 2