Measure of central tendency for a run chart: median
For run charts, we need to display the measure of central tendency,
called the median. The median is very easy to calculate. You line
up all the values in either ascending or descending order and then
find the middle number. The value of the middle number is the
median. When you have an even amount of numbers there will be
two values in the middle. Take these values, add them together and
divide by 2 to give you your median.
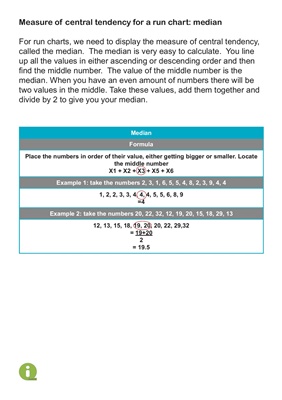
Median
Formula
Place the numbers in order of their value, either getting bigger or smaller. Locate
the middle number
X1 + X2 + X3 + X5 + X6
Example 1: take the numbers 2, 3, 1, 6, 5, 5, 4, 8, 2, 3, 9, 4, 4
1, 2, 2, 3, 3, 4, 4, 4, 5, 5, 6, 8, 9
=4
Example 2: take the numbers 20, 22, 32, 12, 19, 20, 15, 18, 29, 13
12, 13, 15, 18, 19, 20, 20, 22, 29,32
= 19+20
2
= 19.5