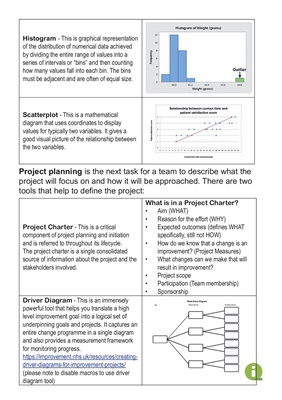
Histogram - This is graphical representation
of the distribution of numerical data achieved
by dividing the entire range of values into a
series of intervals or "bins" and then counting
how many values fall into each bin. The bins
must be adjacent and are often of equal size.
Scatterplot - This is a mathematical
diagram that uses coordinates to display
values for typically two variables. It gives a
good visual picture of the relationship between
the two variables.
Project planning is the next task for a team to describe what the
project will focus on and how it will be approached. There are two
tools that help to define the project:
Project Charter - This is a critical
component of project planning and initiation
and is referred to throughout its lifecycle.
The project charter is a single consolidated
source of information about the project and the
stakeholders involved.
What is in a Project Charter?
• Aim (WHAT)
• Reason for the effort (WHY)
• Expected outcomes (defines WHAT
specifically, still not HOW)
• How do we know that a change is an
improvement? (Project Measures)
• What changes can we make that will
result in improvement?
• Project scope
• Participation (Team membership)
• Sponsorship
Driver Diagram - This is an immensely
powerful tool that helps you translate a high
level improvement goal into a logical set of
underpinning goals and projects. It captures an
entire change programme in a single diagram
and also provides a measurement framework
for monitoring progress.
https://improvement.nhs.uk/resources/creatingdriver-diagrams-for-improvement-projects/
(please note to disable macros to use driver
diagram tool)