Understanding the Problem
One of the first tasks for the QI Team is to understand the extent
of the problem. Collecting baseline data will help the team
understand how well their system works, identify potential areas
for improvement and set measurable aims. A number of tools are
available to help the team with this task:
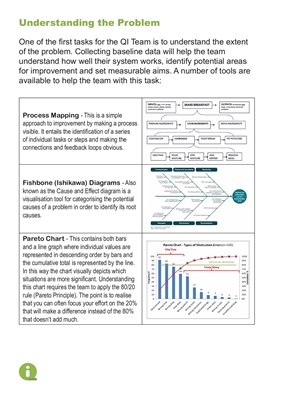
Process Mapping - This is a simple
approach to improvement by making a process
visible. It entails the identification of a series
of individual tasks or steps and making the
connections and feedback loops obvious.
Fishbone (Ishikawa) Diagrams - Also
known as the Cause and Effect diagram is a
visualisation tool for categorising the potential
causes of a problem in order to identify its root
causes.
Pareto Chart - This contains both bars
and a line graph where individual values are
represented in descending order by bars and
the cumulative total is represented by the line.
In this way the chart visually depicts which
situations are more significant. Understanding
this chart requires the team to apply the 80/20
rule (Pareto Principle). The point is to realise
that you can often focus your effort on the 20%
that will make a difference instead of the 80%
that doesn't add much.