LIVING OUR VALUES
Values repOrt 2009
ImPROvEmENTS IN DATA COLLECTION
before being able to meaningfully reduce carbon emissions we need to set up systems to accurately measure our usage.
since our last Values report we have:
Created an in-house monitoring tool that allows us to track emissions from each of our transport mediums, air, sea and road.
set up a reporting agreement with our flights booker which allows us to monitor our emissions from flights.
instigated annual meter reads from stores to identify our annual position.
implemented automatic meter reading equipment for all uk stores.
We are confident in the precision of our air travel and product transport figures, but challenges remain with obtaining robust data
from our 2,500 stores around the world. We currently have strong data from asia, and a strong sample from our uk and emea
stores. in addition, we are now receiving much improved data within the uk due to our automatic meter reading (amrs) units.
REDUCINg CO2 EmISSIONS
Our contribution to climate change comes from 3 main areas of our operations:
electrical energy use in our stores, offices and warehouses.
transportation of our products.
business air travel.
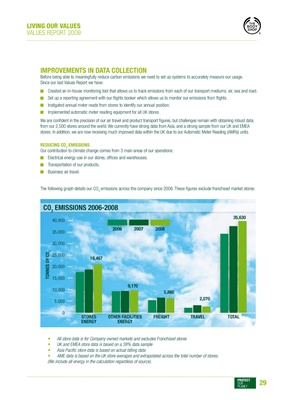
the following graph details our CO2 emissions across the company since 2006. these figures exclude franchised market stores:
CO2 EmISSIONS 2006-2008
35,630
40,000
2006 2007 2008
35,000
30,000
TONNES Of CO2
25,000
18,467
20,000
15,000
9,170
10,000
5,860
2,070
5,000
0
STORES OTHER fACILITIES fREIgHT TRAvEL TOTAL
ENERgY ENERgY
• All store data is for Company owned markets and excludes Franchised stores
• UK and EMEA store data is based on a 38% data sample
• Asia Pacific store data is based on actual billing data
• AME data is based on the UK store averages and extrapolated across the total number of stores.
(We include all energy in the calculation regardless of source).
29