LIVING OUR VALUES
Values repOrt 2009
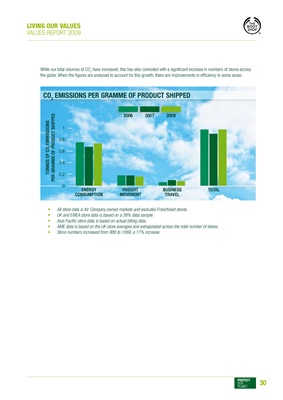
While our total volumes of CO2 have increased, this has also coincided with a significant increase in numbers of stores across
the globe. When the figures are analysed to account for this growth, there are improvements in efficiency in some areas:
CO2 EmISSIONS PER gRAmmE Of PRODUCT SHIPPED
2006 2007 2008
PER gRAmmE Of PRODUCT SHIPPED
TONNES Of CO2 EmmISSIONS
1
0.8
0.6
0.4
0.2
0
ENERgY fREIgHT BUSINESS TOTAL
CONSUmPTION mOvEmENT TRAvEL
• All store data is for Company owned markets and excludes Franchised stores.
• UK and EMEA store data is based on a 38% data sample.
• Asia Pacific store data is based on actual billing data.
• AME data is based on the UK store averages and extrapolated across the total number of stores.
• Store numbers increased from 886 to 1069, a 17% increase.
30