Five year summary
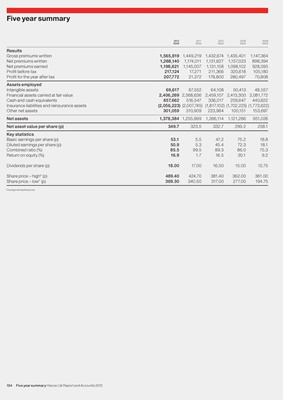
2012 2011 2010 2009 2008
£000 £000 £000 £000 £000
Results
Gross premiums written 1,565,819 1,449,219 1,432,674 1,435,401 1,147,364
Net premiums written 1,268,140 1,174,011 1,131,627 1,157,023 898,394
Net premiums earned 1,198,621 1,145,007 1,131,158 1,098,102 928,095
Profit before tax 217,124 17,271 211,366 320,618 105,180
Profit for the year after tax 207,772 21,272 178,800 280,497 70,808
Assets employed
Intangible assets 69,617 67,552 64,108 50,413 48,557
Financial assets carried at fair value 2,406,269 2,368,636 2,459,107 2,413,300 2,081,772
Cash and cash equivalents 657,662 516,547 336,017 259,647 440,622
Insurance liabilities and reinsurance assets (2,056,223) (2,007,745) (1,817,102) (1,702,225) (1,773,622)
Other net assets 301,059 310,909 223,984 100,151 153,697
Net assets 1,378,384 1,255,899 1,266,114 1,121,286 951,026
Net asset value per share (p) 349.7 323.5 332.7 299.2 258.1
Key statistics
Basic earnings per share (p) 53.1 5.5 47.2 75.2 18.8
Diluted earnings per share (p) 50.9 5.3 45.4 72.3 18.1
Combined ratio (%) 85.5 99.5 89.3 86.0 75.3
Return on equity (%) 16.9 1.7 16.5 30.1 9.2
Dividends per share (p) 18.00 17.00 16.50 15.00 12.75
Share price – high* (p) 489.40 424.70 381.40 362.00 361.00
Share price – low* (p) 369.30 340.50 317.00 277.00 194.75
*Closing mid-market prices.
104 Five year summary Hiscox Ltd Report and Accounts 2012