Notes to the consolidated
financial statements
continued
4 Operating segments continued
(c) Segmental analysis of assets and liabilities
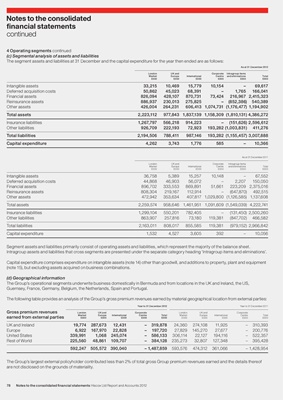
The segment assets and liabilities at 31 December and the capital expenditure for the year then ended are as follows:
As at 31 December 2012
London UK and Corporate Intragroup items
Market Europe International Centre and eliminations Total
£000 £000 £000 £000 £000 £000
Intangible assets 33,215 10,469 15,779 10,154 – 69,617
Deferred acquisition costs 50,862 45,023 68,391 – 1,765 166,041
Financial assets 826,094 428,107 870,731 73,424 216,967 2,415,323
Reinsurance assets 886,937 230,013 275,825 – (852,386) 540,389
Other assets 426,004 264,231 606,413 1,074,731 (1,176,477) 1,194,902
Total assets 2,223,112 977,843 1,837,139 1,158,309 (1,810,131) 4,386,272
Insurance liabilities 1,267,797 566,218 914,223 – (151,626) 2,596,612
Other liabilities 926,709 222,193 72,923 193,282 (1,003,831) 411,276
Total liabilities 2,194,506 788,411 987,146 193,282 (1,155,457) 3,007,888
Capital expenditure 4,262 3,743 1,776 585 – 10,366
As at 31 December 2011
London UK and Corporate Intragroup items
Market Europe International Centre and eliminations Total
£000 £000 £000 £000 £000 £000
Intangible assets 36,758 5,389 15,257 10,148 – 67,552
Deferred acquisition costs 44,868 46,903 56,072 – 2,207 150,050
Financial assets 896,702 333,553 869,891 51,661 223,209 2,375,016
Reinsurance assets 808,304 219,167 112,914 – (647,870) 492,515
Other assets 472,942 353,634 407,817 1,029,800 (1,126,585) 1,137,608
Total assets 2,259,574 958,646 1,461,951 1,091,609 (1,549,039) 4,222,741
Insurance liabilities 1,299,104 550,201 782,405 – (131,450) 2,500,260
Other liabilities 863,907 257,816 73,180 119,381 (847,702) 466,582
Total liabilities 2,163,011 808,017 855,585 119,381 (979,152) 2,966,842
Capital expenditure 1,532 4,527 3,605 392 – 10,056
Segment assets and liabilities primarily consist of operating assets and liabilities, which represent the majority of the balance sheet.
Intragroup assets and liabilities that cross segments are presented under the separate category heading ‘Intragroup items and eliminations’.
Capital expenditure comprises expenditure on intangible assets (note 14) other than goodwill, and additions to property, plant and equipment
(note 15), but excluding assets acquired on business combinations.
(d) Geographical information
The Group’s operational segments underwrite business domestically in Bermuda and from locations in the UK and Ireland, the US,
Guernsey, France, Germany, Belgium, the Netherlands, Spain and Portugal.
The following table provides an analysis of the Group’s gross premium revenues earned by material geographical location from external parties:
Year to 31 December 2012 Year to 31 December 2011
Gross premium revenues London UK and Corporate London UK and Corporate
Market Europe International Centre Total Market Europe International Centre Total
earned from external parties £000 £000 £000 £000 £000 £000 £000 £000 £000 £000
UK and Ireland 19,774 287,673 12,431 – 319,878 24,360 274,108 11,925 – 310,393
Europe 6,922 167,970 22,828 – 197,720 27,829 145,270 27,677 – 200,776
United States 339,991 1,068 245,074 – 586,133 306,114 22,127 194,116 – 522,357
Rest of World 225,560 48,861 109,707 – 384,128 235,273 32,807 127,348 – 395,428
592,247 505,572 390,040 – 1,487,859 593,576 474,312 361,066 – 1,428,954
The Group’s largest external policyholder contributed less than 2% of total gross Group premium revenues earned and the details thereof
are not disclosed on the grounds of materiality.
78 Notes to the consolidated financial statements Hiscox Ltd Report and Accounts 2012