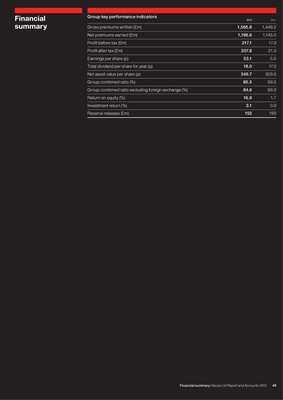
Financial Group key performance indicators
2012 2011
summary Gross premiums written (£m) 1,565.8 1,449.2
Net premiums earned (£m) 1,198.6 1,145.0
Profit before tax (£m) 217.1 17.3
Profit after tax (£m) 207.8 21.3
Earnings per share (p) 53.1 5.5
Total dividend per share for year (p) 18.0 17.0
Net asset value per share (p) 349.7 323.5
Group combined ratio (%) 85.5 99.5
Group combined ratio excluding foreign exchange (%) 84.6 99.3
Return on equity (%) 16.9 1.7
Investment return (%) 3.1 0.9
Reserve releases (£m) 152 199
Financial summary Hiscox Ltd Report and Accounts 2012 49