Corporate Group key performance indicators
2012 2011
highlights Gross premiums written (£m) 1,565.8 1,449.2
Net premiums earned (£m) 1,198.6 1,145.0
Profit before tax (£m) 217.1 17.3
Profit after tax (£m) 207.8 21.3
Earnings per share (p) 53.1 5.5
Total dividend per share for year (p) 18.0 17.0
Net asset value per share (p) 349.7 323.5
Group combined ratio (%) 85.5 99.5
Group combined ratio excluding foreign exchange (%) 84.6 99.3
Return on equity (%) 16.9 1.7
Investment return (%) 3.1 0.9
Reserve releases (£m) 152 199
Capital return
Capital return of £200 million (50.0p per share including final dividend) by way of B share scheme
Final dividend equivalent of 12.0p taking total dividend for the year to 18.0p, an increase
of 5.9% (2011: 17.0p)
Additional special distribution of 38.0p per share (approximately £150 million) combined
with share consolidation
Operational highlights
Robert Childs replaces Robert Hiscox as Chairman on 26 February 2013;
Richard Watson now Chief Underwriting Officer
Hiscox London Market profit of £121.9 million (2011: £57.6 million) with contributions across all lines
Hiscox Bermuda delivered a pleasing profit despite Superstorm Sandy
UK retail business delivers another good profit of £45.2 million (2011: £49.0 million)
Hiscox USA revenues grew by 32.6% to $230.5 million. US Direct business increased by over
200% to nearly $10.0 million gross premiums written with strong continued growth prospects
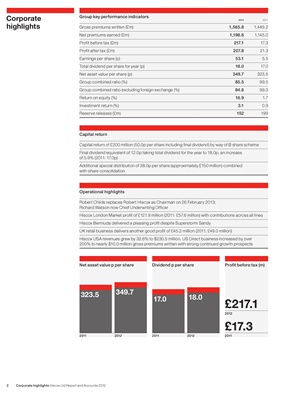
Net asset value p per share Dividend p per share Profit before tax (m)
323.5 349.7
17.0 18.0
£217.1
2012
£17.3
2011 2012 2011 2012 2011
2 Corporate highlights Hiscox Ltd Report and Accounts 2012