Notes to the consolidated
financial statements
continued
4 Operating segments continued
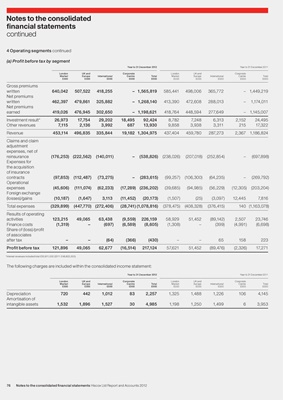
(a) Profit before tax by segment
Year to 31 December 2012 Year to 31 December 2011
London UK and Corporate London UK and Corporate
Market Europe International Centre Total Market Europe International Centre Total
£000 £000 £000 £000 £000 £000 £000 £000 £000 £000
Gross premiums
written 640,042 507,522 418,255 – 1,565,819 585,441 498,006 365,772 – 1,449,219
Net premiums
written 462,397 479,861 325,882 – 1,268,140 413,390 472,608 288,013 – 1,174,011
Net premiums
earned 419,026 476,945 302,650 – 1,198,621 418,764 448,594 277,649 – 1,145,007
Investment result* 26,973 17,754 29,202 18,495 92,424 8,782 7,248 6,313 2,152 24,495
Other revenues 7,115 2,136 3,992 687 13,930 9,858 3,938 3,311 215 17,322
Revenue 453,114 496,835 335,844 19,182 1,304,975 437,404 459,780 287,273 2,367 1,186,824
Claims and claim
adjustment
expenses, net of
reinsurance (176,253) (222,562) (140,011) – (538,826) (238,026) (207,018) (252,854) – (697,898)
Expenses for
the acquisition
of insurance
contracts (97,853) (112,487) (73,275) – (283,615) (99,257) (106,300) (64,235) – (269,792)
Operational
expenses (45,606) (111,074) (62,233) (17,289) (236,202) (39,685) (94,985) (56,229) (12,305) (203,204)
Foreign exchange
(losses)/gains (10,187) (1,647) 3,113 (11,452) (20,173) (1,507) (25) (3,097) 12,445 7,816
Total expenses (329,899) (447,770) (272,406) (28,741) (1,078,816) (378,475) (408,328) (376,415) 140 (1,163,078)
Results of operating
activities 123,215 49,065 63,438 (9,559) 226,159 58,929 51,452 (89,142) 2,507 23,746
Finance costs (1,319) – (697) (6,589) (8,605) (1,308) – (399) (4,991) (6,698)
Share of (loss)/profit
of associates
after tax – – (64) (366) (430) – – 65 158 223
Profit before tax 121,896 49,065 62,677 (16,514) 217,124 57,621 51,452 (89,476) (2,326) 17,271
*Interest revenues included total £50,811,000 (2011: £48,802,000).
The following charges are included within the consolidated income statement:
Year to 31 December 2012 Year to 31 December 2011
London UK and Corporate London UK and Corporate
Market Europe International Centre Total Market Europe International Centre Total
£000 £000 £000 £000 £000 £000 £000 £000 £000 £000
Depreciation 720 442 1,012 83 2,257 1,325 1,488 1,226 106 4,145
Amortisation of
intangible assets 1,532 1,896 1,527 30 4,985 1,198 1,250 1,499 6 3,953
76 Notes to the consolidated financial statements Hiscox Ltd Report and Accounts 2012