The Group’s invested assets at 31 December benchmarks and generated much better returns
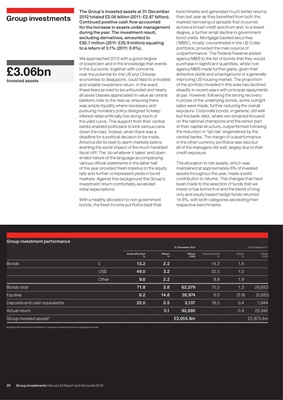
Group investments 2012 totaled £3.06 billion (2011: £2.87 billion).
Continued positive cash flow accounted
than last year as they benefited from both the
marked narrowing of spreads that occurred
for the increase in assets under management across a broad credit spectrum and, to a lesser
during the year. The investment result, degree, a further small decline in government
excluding derivatives, amounted to bond yields. Mortgage backed securities
£92.7 million (2011: £25.9 million) equating (‘MBS’), mostly concentrated in the US Dollar
to a return of 3.1% (2011: 0.9%). portfolios, provided the main source of
outperformance. The Federal Reserve added
We approached 2012 with a good degree agency MBS to the list of bonds that they would
of scepticism and in the knowledge that events purchase in significant quantities, whilst non
£3.06bn in the Eurozone, together with concerns
over the potential for the US and Chinese
economies to disappoint, could lead to a modest
agency MBS made further gains, given their
attractive yields and a background of a generally
improving US housing market. The proportion
Invested assets
and volatile investment return. In the event of the portfolio invested in this area has declined
these fears proved to be unfounded and nearly steadily in recent years with principal repayments
all asset classes appreciated in value as central at par. However, following the strong recovery
bankers rode to the rescue, ensuring there in prices of the underlying bonds, some outright
was ample liquidity where necessary and sales were made, further reducing the overall
pursuing monetary policy designed to keep exposure. Corporate bonds, in general, did well
interest rates artificially low along much of but the bank debt, where we remained focused
the yield curve. This support from their central on the national champions and the senior part
banks enabled politicians to kick various cans of their capital structure, outperformed following
down the road. Indeed, when there was a the reduction in ‘tail risk’ engendered by the
deadline for a political decision to be made, central banks. The margin of outperformance
America did its best to alarm markets before in the other currency portfolios was less but
averting the worst impact of the much heralded all of the managers did well, largely due to their
fiscal cliff. The ‘do whatever it takes’ and open- credit exposure.
ended nature of the language accompanying
various official statements in the latter half The allocation to risk assets, which was
of the year provided fresh impetus to the equity maintained at approximately 6% of invested
rally and further compressed yields in bond assets throughout the year, made a solid
markets. Against this background the Group’s contribution to returns. The changes that have
investment return comfortably exceeded been made to the selection of funds that we
initial expectations. invest in has borne fruit and the blend of long
only and equity based hedge funds returned
With a healthy allocation to non government 14.8%, with both categories exceeding their
bonds, the fixed income portfolios beat their respective benchmarks.
Group investment performance
31 December 2012 31 December 2011
Asset allocation Return Return Asset allocation Return Return
% % £000 % % £000
Bonds £ 13.2 2.2 14.2 1.6
US$ 49.0 3.2 52.5 1.0
Other 9.6 2.2 8.8 1.9
Bonds total 71.8 2.8 62,579 75.5 1.3 29,933
Equities 6.2 14.8 26,974 6.0 (3.8) (5,935)
Deposits and cash equivalents 22.0 0.5 3,137 18.5 0.4 1,944
Actual return 3.1 92,690 0.9 25,942
Group invested assets* £3,055.8m £2,873.4m
*excludes derivatives and investment in insurance linked fund and in catastrophe bonds.
20 Group investments Hiscox Ltd Report and Accounts 2012