4 Operating segments continued
(a) Profit before tax by segment continued
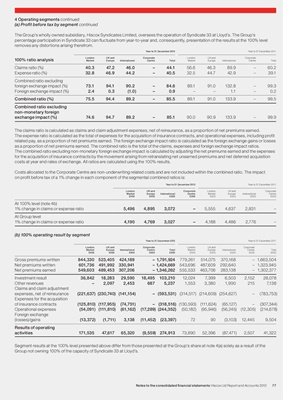
The Group’s wholly owned subsidiary, Hiscox Syndicates Limited, oversees the operation of Syndicate 33 at Lloyd’s. The Group’s
percentage participation in Syndicate 33 can fluctuate from year-to-year and, consequently, presentation of the results at the 100% level
removes any distortions arising therefrom.
Year to 31 December 2012 Year to 31 December 2011
London UK and Corporate London UK and Corporate
100% ratio analysis Market Europe International Centre Total Market Europe International Centre Total
Claims ratio (%) 40.3 47.2 46.0 – 44.1 56.6 46.3 89.9 – 60.2
Expense ratio (%) 32.8 46.9 44.2 – 40.5 32.5 44.7 42.9 – 39.1
Combined ratio excluding
foreign exchange impact (%) 73.1 94.1 90.2 – 84.6 89.1 91.0 132.8 – 99.3
Foreign exchange impact (%) 2.4 0.3 (1.0) – 0.9 – – 1.1 – 0.2
Combined ratio (%) 75.5 94.4 89.2 – 85.5 89.1 91.0 133.9 – 99.5
Combined ratio excluding
non-monetary foreign
exchange impact (%) 74.6 94.7 89.2 – 85.1 90.0 90.9 133.9 – 99.9
The claims ratio is calculated as claims and claim adjustment expenses, net of reinsurance, as a proportion of net premiums earned.
The expense ratio is calculated as the total of expenses for the acquisition of insurance contracts, and operational expenses, including profit
related pay, as a proportion of net premiums earned. The foreign exchange impact ratio is calculated as the foreign exchange gains or losses
as a proportion of net premiums earned. The combined ratio is the total of the claims, expenses and foreign exchange impact ratios.
The combined ratio excluding non-monetary foreign exchange impact is calculated by adjusting the net premiums earned and the expenses
for the acquisition of insurance contracts by the movement arising from retranslating net unearned premiums and net deferred acquisition
costs at year end rates of exchange. All ratios are calculated using the 100% results.
Costs allocated to the Corporate Centre are non-underwriting related costs and are not included within the combined ratio. The impact
on profit before tax of a 1% change in each component of the segmental combined ratios is:
Year to 31 December 2012 Year to 31 December 2011
London UK and Corporate London UK and Corporate
Market Europe International Centre Market Europe International Centre
£000 £000 £000 £000 £000 £000 £000 £000
At 100% level (note 4b)
1% change in claims or expense ratio 5,496 4,895 3,072 – 5,555 4,637 2,831 –
At Group level
1% change in claims or expense ratio 4,190 4,769 3,027 – 4,188 4,486 2,776 –
(b) 100% operating result by segment
Year to 31 December 2012 Year to 31 December 2011
London UK and Corporate London UK and Corporate
Market Europe International Centre Total Market Europe International Centre Total
£000 £000 £000 £000 £000 £000 £000 £000 £000 £000
Gross premiums written 844,330 523,405 424,189 – 1,791,924 779,261 514,075 370,168 – 1,663,504
Net premiums written 601,736 491,992 330,941 – 1,424,669 543,696 487,609 292,640 – 1,323,945
Net premiums earned 549,603 489,453 307,206 – 1,346,262 555,533 463,706 283,138 – 1,302,377
Investment result 36,842 18,283 29,590 18,495 103,210 12,024 7,399 6,503 2,152 28,078
Other revenues – 2,097 2,453 687 5,237 1,553 3,380 1,990 215 7,138
Claims and claim adjustment
expenses, net of reinsurance (221,637) (230,740) (141,154) – (593,531) (314,517) (214,609) (254,627) – (783,753)
Expenses for the acquisition
of insurance contracts (125,810) (117,955) (74,751) – (318,516) (130,593) (111,624) (65,127) – (307,344)
Operational expenses (54,091) (111,810) (61,162) (17,289) (244,352) (50,182) (95,946) (56,245) (12,305) (214,678)
Foreign exchange
(losses)/gains (13,372) (1,711) 3,138 (11,452) (23,397) 72 90 (3,103) 12,445 9,504
Results of operating
activities 171,535 47,617 65,320 (9,559) 274,913 73,890 52,396 (87,471) 2,507 41,322
Segment results at the 100% level presented above differ from those presented at the Group’s share at note 4(a) solely as a result of the
Group not owning 100% of the capacity of Syndicate 33 at Lloyd’s.
Notes to the consolidated financial statements Hiscox Ltd Report and Accounts 2012 77