Actively managed
key underwriting
exposures
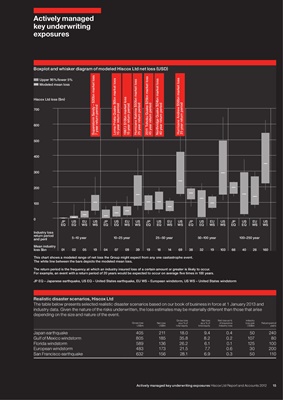
Boxplot and whisker diagram of modeled Hiscox Ltd net loss (USD)
Superstorm Sandy – $20bn market loss
2011 Tohoku Quake $25bn market loss
Hurricane Andrew $56bn market loss
Upper 95%/lower 5%
Loma Prieta Quake $6bn market loss
Northridge Quake $24bn market loss
Hurricane Katrina $50bn market loss
Modeled mean loss
1987J $10bn market loss
Hiscox Ltd loss ($m)
25 year return period
25 year return period
45 year return period
40 year return period
15 year return period
15 year return period
7 year return period
700
600
500
400
300
200
100
0
JP US EU US JP US EU US JP US EU US JP US EU US JP US EU US
EQ EQ WS WS EQ EQ WS WS EQ EQ WS WS EQ EQ WS WS EQ EQ WS WS
Industry loss
return period
and peril 5–10 year 10–25 year 25–50 year 50–100 year 100–250 year
Mean industry
loss $bn 01 02 05 19 04 07 09 39 19 18 14 69 38 32 19 103 66 40 26 160
This chart shows a modeled range of net loss the Group might expect from any one castastrophe event.
The white line between the bars depicts the modeled mean loss.
The return period is the frequency at which an industry insured loss of a certain amount or greater is likely to occur.
For example, an event with a return period of 20 years would be expected to occur on average ve times in 100 years.
JP EQ – Japanese earthquake, US EQ – United States earthquake, EU WS – European windstorm, US WS – United States windstorm
Realistic disaster scenarios, Hiscox Ltd
The table below presents selected realistic disaster scenarios based on our book of business in force at 1 January 2013 and
industry data. Given the nature of the risks underwritten, the loss estimates may be materially different than those that arise
depending on the size and nature of the event.
Gross loss Net loss Net loss as % Industry
Gross loss Net loss as a % of as a % of of insurance loss size Return period
US$m US$m total equity total equity industry loss US$bn years
Japan earthquake 405 211 18.0 9.4 0.4 50 240
Gulf of Mexico windstorm 805 185 35.8 8.2 0.2 107 80
Florida windstorm 589 136 26.2 6.1 0.1 125 100
European windstorm 483 173 21.5 7.7 0.6 30 200
San Francisco earthquake 632 156 28.1 6.9 0.3 50 110
Actively managed key underwriting exposures Hiscox Ltd Report and Accounts 2012 15