Finance Director Review 13
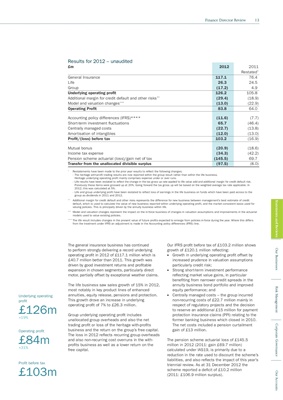
Results for 2012 – unaudited
£m 2012 2011
Restated*
General Insurance 117.1 76.4
Life 26.3 24.5
Group (17.2) 4.9
Underlying operating profit 126.2 105.8
Additional margin for credit default and other risks** (29.4) (18.9)
Model and valuation changes*** (13.0) (22.9)
Operating Profit 83.8 64.0
Accounting policy differences (IFRS)**** (11.6) (7.7)
Short-term investment fluctuations 65.7 (46.4)
Centrally managed costs (22.7) (13.8)
Amortisation of intangibles (12.0) (13.0)
Profit/(loss) before tax 103.2 (16.9)
Mutual bonus (20.9) (18.6)
Income tax expense (34.3) (42.2)
Pension scheme actuarial (loss)/gain net of tax (145.5) 69.7
Transfer from the unallocated divisible surplus (97.5) (8.0)
*
Restatements have been made to the prior year results to reflect the following changes;
- The heritage with-profit trading results are now reported within the group result rather than within the life business.
Heritage underlying operating profit mainly comprises expense under or over runs.
- Life results have been restated to reflect the change in the tax gross up rate applied to life value add and additional margin for credit default risk.
Previously these items were grossed up at 20%. Going forward the tax gross up will be based on the weighted average tax rate applicable. In
2012, this was calculated at 5%.
- Life and group underlying profit have been restated to reflect loss of earnings in the life business on funds which have been paid across to the
group as dividends in 2011 and 2012.
**
Additional margin for credit default and other risks represents the difference for new business between management’s best estimate of credit
Statements and Reviews
default, which is used to calculate the value of new business reported within underlying operating profit, and the market consistent basis used for
valuing policies. This is principally driven by the annuity business within life.
***
Model and valuation changes represent the impact on the in-force business of changes in valuation assumptions and improvements in the actuarial
models used to value existing policies.
****
The life result includes changes in the present value of future profits expected to emerge from policies in-force during the year. Where this differs
from the treatment under IFRS an adjustment is made in the Accounting policy differences (IFRS) line.
The general insurance business has continued Our IFRS profit before tax of £103.2 million shows
to perform strongly delivering a record underlying growth of £120.1 million reflecting:
Our Businesses
operating profit in 2012 of £117.1 million which is l Growth in underlying operating profit offset by
£40.7 million better than 2011. This growth was increased prudence in valuation assumptions
driven by good investment returns and profitable particularly credit risk;
expansion in chosen segments, particularly direct l Strong short-term investment performance
motor, partially offset by exceptional weather claims. reflecting market value gains, in particular
benefiting from narrower credit spreads in the
The life business saw sales growth of 15% in 2012, annuity business bond portfolio and improved
Risk Management
most notably in key product lines of enhanced equity performance; and
Underlying operating annuities, equity release, pensions and protection. l Centrally managed costs – the group incurred
profit This growth drove an increase in underlying non-recurring costs of £22.7 million mainly in
operating profit of 7% to £26.3 million. respect of regulatory projects and the decision
£126m
+19%
Group underlying operating profit includes
to reserve an additional £15 million for payment
protection insurance claims (PPI) relating to the
unallocated group overheads and also the net former banking business which closed in 2010.
trading profit or loss of the heritage with-profits The net costs included a pension curtailment
Corporate Governance
Operating profit business and the return on the group’s free capital. gain of £13 million.
The loss in 2012 reflects recurring group overheads
£84m
+31%
and also non-recurring cost overruns in the with-
profits business as well as a lower return on the
The pension scheme actuarial loss of £145.5
million in 2012 (2011: gain £69.7 million)
free capital. calculated under IAS19, is primarily due to a
reduction in the rate used to discount the scheme’s
liabilities, and also reflects the impact of this year’s
Profit before tax triennial review. As at 31 December 2012 the
£103m scheme reported a deficit of £10.2 million
Our Accounts
(2011: £106.9 million surplus).