Our Accounts 67
Notes to the Financial Statements continued
31 December 2012
3. Risk management and control (continued)
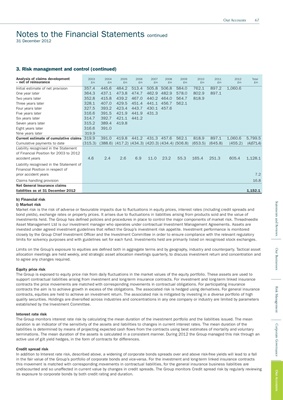
Analysis of claims development 2003 2004 2005 2006 2007 2008 2009 2010 2011 2012 Total
– net of reinsurance £m £m £m £m £m £m £m £m £m £m £m
Initial estimate of net provision 357.4 445.6 484.2 513.4 505.8 506.8 584.0 762.1 897.2 1,060.6
One year later 364.3 437.1 473.8 474.7 462.9 482.9 578.0 802.9 897.1
Two years later 352.8 415.8 439.2 467.0 440.2 464.0 564.7 818.9
Three years later 328.1 407.0 429.5 451.4 441.1 456.7 562.1
Four years later 327.5 393.2 423.4 443.7 430.1 457.6
Five years later 316.6 391.5 421.9 441.9 431.3
Six years later 314.7 392.7 421.1 441.2
Seven years later 315.2 389.4 419.8
Eight years later 316.6 391.0
Nine years later 319.9
Current estimate of cumulative claims 319.9 391.0 419.8 441.2 431.3 457.6 562.1 818.9 897.1 1,060.6 5,799.5
Cumulative payments to date (315.3) (388.6) (417.2) (434.3) (420.3) (434.4) (506.8) (653.5) (645.8) (455.2) (4,671.4)
Liability recognised in the Statement
of Financial Position for 2003 to 2012
accident years 4.6 2.4 2.6 6.9 11.0 23.2 55.3 165.4 251.3 605.4 1,128.1
Liability recognised in the Statement of
Financial Position in respect of
prior accident years 7.2
Claims handling provision 16.8
Net General Insurance claims
liabilities as at 31 December 2012 1,152.1
b) Financial risk
Statements and Reviews
i) Market risk
Market risk is the risk of adverse or favourable impacts due to fluctuations in equity prices, interest rates (including credit spreads and
bond yields), exchange rates or property prices. It arises due to fluctuations in liabilities arising from products sold and the value of
investments held. The Group has defined policies and procedures in place to control the major components of market risk. Threadneedle
Asset Management Ltd is our investment manager who operates under contractual Investment Management Agreements. Assets are
invested under agreed investment guidelines that reflect the Group’s investment risk appetite. Investment performance is monitored
closely by the Group Chief Investment Officer and the Investment Committee in order to ensure compliance with the relevant regulatory
limits for solvency purposes and with guidelines set for each fund. Investments held are primarily listed on recognised stock exchanges.
Limits on the Group’s exposure to equities are defined both in aggregate terms and by geography, industry and counterparty. Tactical asset
Our Businesses
allocation meetings are held weekly, and strategic asset allocation meetings quarterly, to discuss investment return and concentration and
to agree any changes required.
Equity price risk
The Group is exposed to equity price risk from daily fluctuations in the market values of the equity portfolio. These assets are used to
support contractual liabilities arising from investment and long-term insurance contracts. For investment and long-term linked insurance
contracts the price movements are matched with corresponding movements in contractual obligations. For participating insurance
Risk Management
contracts the aim is to achieve growth in excess of the obligations. The associated risk is hedged using derivatives. For general insurance
contracts, equities are held to achieve an investment return. The associated risk is mitigated by investing in a diverse portfolio of high
quality securities. Holdings are diversified across industries and concentrations in any one company or industry are limited by parameters
established by the Investment Committee.
Interest rate risk
The Group monitors interest rate risk by calculating the mean duration of the investment portfolio and the liabilities issued. The mean
duration is an indicator of the sensitivity of the assets and liabilities to changes in current interest rates. The mean duration of the
Corporate Governance
liabilities is determined by means of projecting expected cash flows from the contracts using best estimates of mortality and voluntary
terminations. The mean duration of the assets is calculated in a consistent manner. During 2012 the Group managed this risk through an
active use of gilt yield hedges, in the form of contracts for differences.
Credit spread risk
In addition to Interest rate risk, described above, a widening of corporate bonds spreads over and above risk-free yields will lead to a fall
in the fair value of the Group’s portfolio of corporate bonds and vice-versa. For the investment and long-term linked insurance contracts
this movement is matched with corresponding movements in contractual liabilities, for the general insurance business liabilities are
undiscounted and so unaffected in current value by changes in credit spreads. The Group monitors Credit spread risk by regularly reviewing
Our Accounts
its exposure to corporate bonds by both credit rating and duration.