Our Accounts 57
Statement of Cash Flows
Year ended 31 December 2012
Group Society
2012 2011 2012 2011
Restated Restated
see Note 1 see Note 1
Notes £m £m £m £m
Cash and cash equivalents at 1 January 719.1 547.4 283.4 289.0
Cash flows arising from:
Operating activities
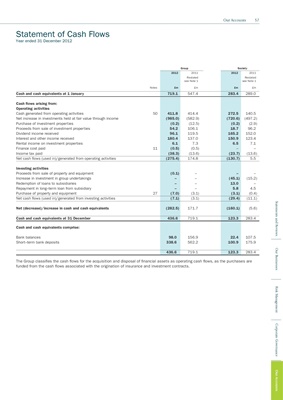
Cash generated from operating activities 50 411.8 414.4 272.5 140.5
Net increase in investments held at fair value through income (985.0) (582.9) (720.6) (497.2)
Purchase of investment properties (0.2) (12.5) (0.2) (2.9)
Proceeds from sale of investment properties 54.2 106.1 18.7 96.2
Dividend income received 96.1 119.5 165.2 152.0
Interest and other income received 180.4 137.0 150.9 123.4
Rental income on investment properties 6.1 7.3 6.5 7.1
Finance cost paid 11 (0.5) (0.5) – –
Income tax paid (38.3) (13.6) (23.7) (13.6)
Net cash flows (used in)/generated from operating activities (275.4) 174.8 (130.7) 5.5
Investing activities
Proceeds from sale of property and equipment (0.1) – – –
Increase in investment in group undertakings – – (45.1) (15.2)
Redemption of loans to subsidiaries – – 13.0 –
Repayment in long–term loan from subsidiary – – 5.8 4.5
Purchase of property and equipment 27 (7.0) (3.1) (3.1) (0.4)
Net cash flows (used in)/generated from investing activities (7.1) (3.1) (29.4) (11.1)
Statements and Reviews
Net (decrease)/increase in cash and cash equivalents (282.5) 171.7 (160.1) (5.6)
Cash and cash equivalents at 31 December 436.6 719.1 123.3 283.4
Cash and cash equivalents comprise:
Bank balances 98.0 156.9 22.4 107.5
Short–term bank deposits 338.6 562.2 100.9 175.9
Our Businesses
436.6 719.1 123.3 283.4
The Group classifies the cash flows for the acquisition and disposal of financial assets as operating cash flows, as the purchases are
funded from the cash flows associated with the origination of insurance and investment contracts.
Risk Management
Corporate Governance
Our Accounts