70 LV= Annual Report 2012
Notes to the Financial Statements continued
31 December 2012
3. Risk management and control (continued)
Below
AAA AA A BBB BBB Not rated Total
Credit risk exposure 2011 £m £m £m £m £m £m £m
Debt and other fixed income securities 2,947.1 392.1 1,236.0 698.4 33.7 33.7 5,341.0
Loans secured on residential property – – – – – 334.2 334.2
Other – – – – – 1.7 1.7
Loans secured by policies – – – – – 0.6 0.6
Other loans – – – – – 0.4 0.4
Short-term deposits – 55.0 501.9 1.0 – 4.3 562.2
2,947.1 447.1 1,737.9 699.4 33.7 374.9 6,240.1
Reinsurance assets
- non linked 3.5 185.5 88.9 – – 36.0 313.9
- linked – 23.0 – – – – 23.0
2,950.6 655.6 1,826.8 699.4 33.7 410.9 6,577.0
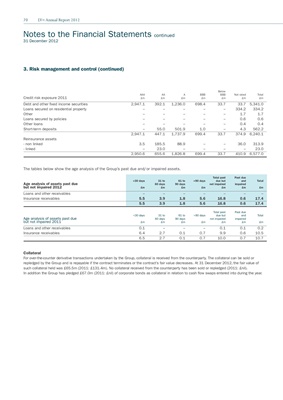
The tables below show the age analysis of the Group’s past due and/or impaired assets.
Total past Past due
<30 days 31 to 61 to >90 days due but and Total
Age analysis of assets past due 60 days 90 days not impaired impaired
but not impaired 2012 £m £m £m £m £m £m £m
Loans and other receivables – – – – – – –
Insurance receivables 5.5 3.9 1.8 5.6 16.8 0.6 17.4
5.5 3.9 1.8 5.6 16.8 0.6 17.4
Total past Past due
<30 days 31 to 61 to >90 days due but and Total
Age analysis of assets past due 60 days 90 days not impaired impaired
but not impaired 2011 £m £m £m £m £m £m £m
Loans and other receivables 0.1 – – – 0.1 0.1 0.2
Insurance receivables 6.4 2.7 0.1 0.7 9.9 0.6 10.5
6.5 2.7 0.1 0.7 10.0 0.7 10.7
Collateral
For over-the-counter derivative transactions undertaken by the Group, collateral is received from the counterparty. The collateral can be sold or
repledged by the Group and is repayable if the contract terminates or the contract’s fair value decreases. At 31 December 2012, the fair value of
such collateral held was £65.5m (2011: £131.4m). No collateral received from the counterparty has been sold or repledged (2011: £nil).
In addition the Group has pledged £67.0m (2011: £nil) of corporate bonds as collateral in relation to cash flow swaps entered into during the year.