Corporate Governance 49
Remuneration during 2012 LTIP cycles currently in progress
The remuneration of individual directors, including l The schemes which started on 1 January 2011
that of the chairman and highest paid director, is and 2012 require a minimum of 9% per annum
detailed on page 48. growth in the Enterprise Value of the business
units to be achieved by 31 December 2013 and
Annual bonus 2012 2014 respectively. For some participants, these
During 2012, the group significantly exceeded schemes also require an above benchmark
many of its financial performance targets, whilst return on investment performance of 60 basis
continuing to grow the business and delivering points per annum. These schemes are still
on our major promises and commitments to our open and have 56 and 79 remaining
members. The committee determined that the participants respectively.
bonuses for the executive directors should therefore l For the schemes which started on 1 January
be at 110% for the chief executive; 75% for the 2011 and 1 January 2012, if the performance
finance director; 78% for the MD, Life Insurance; conditions are met these would pay out between
78% for the MD, General Insurance. £2.2 million and £8.8 million and £2.8 million
and £11.3 million respectively, depending
LTIP payments in 2012 on performance.
The LTIP scheme which started on 1 January 2010 l The amount charged to comprehensive income in
required annual growth in total of the business units 2012 in respect off all open LTIP schemes was
Enterprise Value of between 9% and 20% per annum £9.6 million (2011: £7.3 million).
over the three year period ending 31 December l The estimated costs of any expected awards
2012. For some LTIP scheme participants an above under the schemes are charged as expenses
benchmark return on investment performance of 60 in equal instalments over the three year
basis points per annum was also required. It has performance period concerned.
been determined that these hurdles were
exceeded and accordingly a maximum payout
of £7.5 million (excluding employer’s national
insurance contributions) has been distributed
among 47 participants.
Long Term Incentive Plans – performance of current schemes
Statements and Reviews
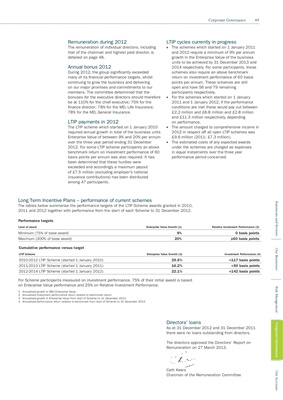
The tables below summarise the performance targets of the LTIP Scheme awards granted in 2010,
2011 and 2012 together with performance from the start of each Scheme to 31 December 2012.
Performance targets
Level of award Enterprise Value Growth (1) Relative Investment Performance (2)
Minimum (75% of base award) 9% 0 basis points
Maximum (300% of base award) 20% >60 basis points
Cumulative performance versus target
Our Businesses
LTIP Scheme Enterprise Value Growth (3) Investment Performance (4)
2010-2012 LTIP Scheme (started 1 January 2010) 29.5% +117 basis points
2011-2013 LTIP Scheme (started 1 January 2011) 16.2% +50 basis points
2012-2014 LTIP Scheme (started 1 January 2012) 22.1% +142 basis points
For Scheme participants measured on investment performance, 75% of their initial award is based
on Enterprise Value performance and 25% on Relative Investment Performance.
Risk Management
1 Annualised growth in SBU Enterprise Value.
2 Annualised investment performance return relative to benchmark return.
3 Annualised growth in Enterprise Value from start of Scheme to 31 December 2012.
4 Annualised performance return relative to benchmark from start of Scheme to 31 December 2012.
Directors’ loans
Corporate Governance
As at 31 December 2012 and 31 December 2011
there were no loans outstanding from directors.
The directors approved the Directors’ Report on
Remuneration on 27 March 2013.
Cath Keers
Our Accounts
Chairman of the Remuneration Committee