86 LV= Annual Report 2012
Notes to the Financial Statements continued
31 December 2012
18. Fair value estimation (continued)
Total gains/
(losses)
At 1 recognised Transfers At 31
January through to level 1 December
2012 income Purchases Sales* and level 2 2012
Society £m £m £m £m £m £m
Financial assets
Derivative financial instruments
Interest rate swaps 64.2 (0.1) – (44.1) – 20.0
Swaptions 29.6 (2.3) – (9.4) – 17.9
Equity/index derivatives 39.7 (9.1) – – – 30.6
133.5 (11.5) – (53.5) – 68.5
Financial assets held at fair value through income
Shares, other variable yield securities and units in unit trusts
– UK unlisted 113.9 11.6 0.8 (14.0) – 112.3
– Overseas unlisted 91.5 0.4 0.6 (0.5) – 92.0
Debt and other fixed income securities
– UK listed 0.7 – – – (0.7) –
– Overseas listed 1.1 – – – (1.1) –
Loan to group undertaking 162.2 (22.1) – (140.1) – –
Loans secured on residential property (note 1) 111.1 43.0 219.4 (7.3) – 366.2
480.5 32.9 220.8 (161.9) (1.8) 570.5
614.0 21.4 220.8 (215.4) (1.8) 639.0
Financial liabilities
Investment contract liabilities 113.4 1.3 – – – 114.7
Derivative financial instruments
Cash flow swaps – (4.3) 55.5 – – 51.2
Property index swap 0.2 – – (0.2) – –
0.2 (4.3) 55.5 (0.2) – 51.2
113.6 (3.0) 55.5 (0.2) – 165.9
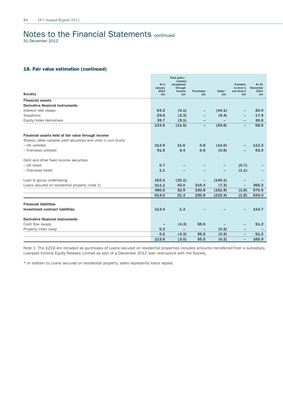
Note 1: The £219.4m included as purchases of Loans secured on residential properties includes amounts transferred from a subsidiary,
Liverpool Victoria Equity Release Limited as part of a December 2012 loan restructure with the Society.
* In relation to Loans secured on residential property, sales represents loans repaid.